China’s economic outlook amid the new international challenges
Information
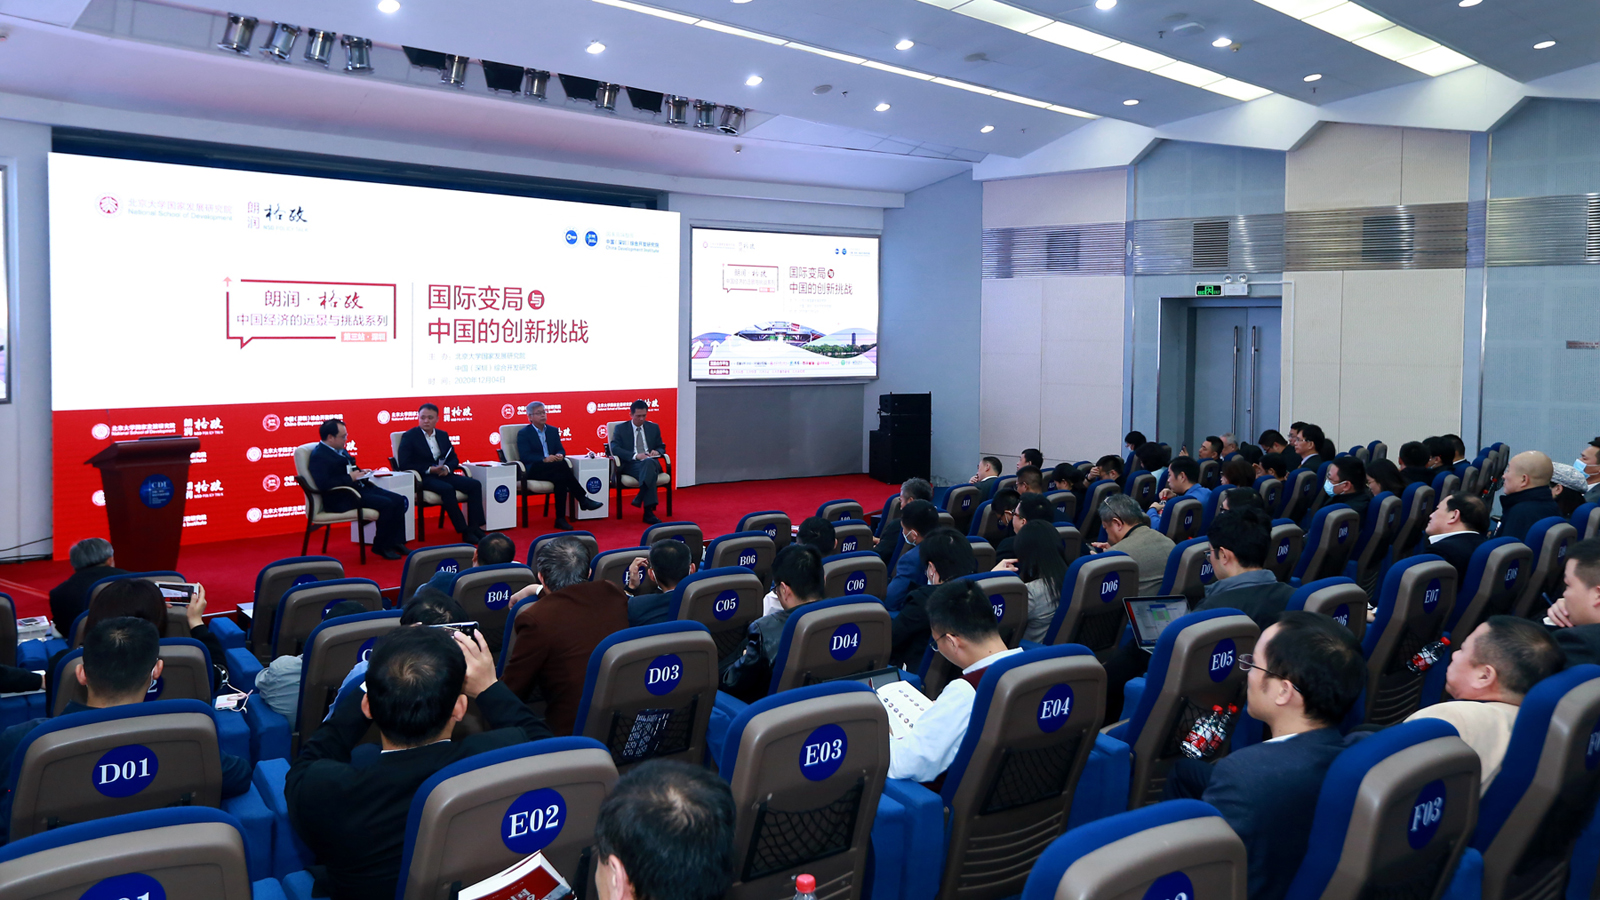
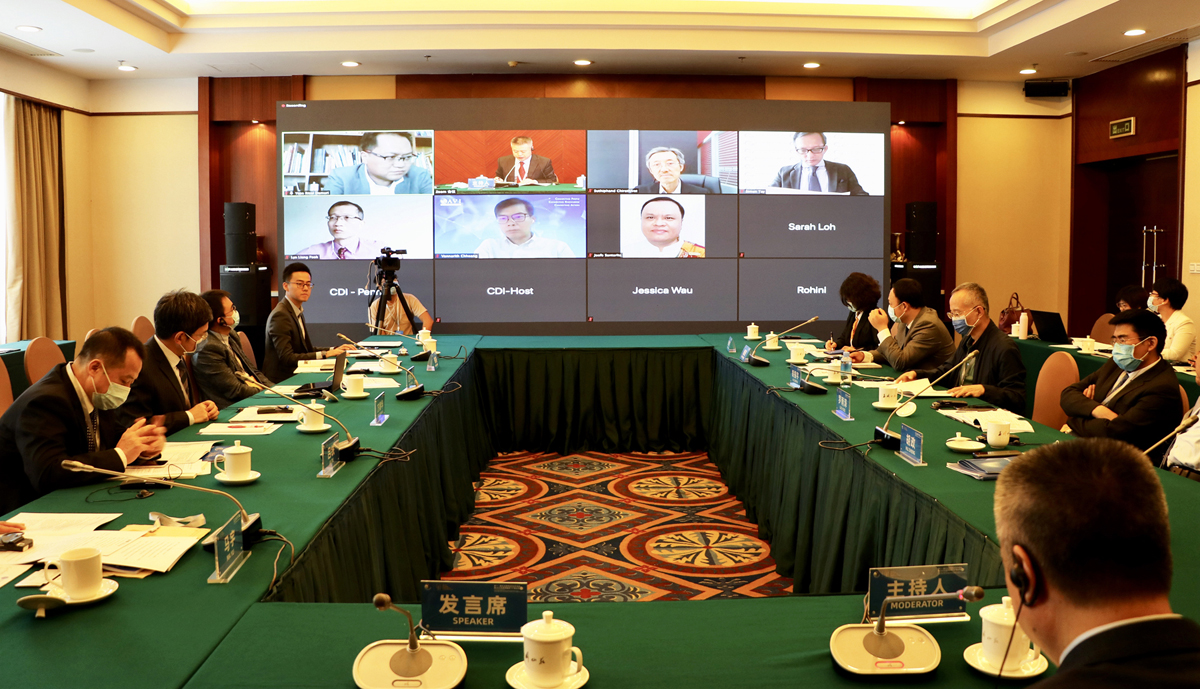
On December 4th, the China Development Institute and the National School of Development at Peking University co-hosted a policy talk on China’s economic outlook amid the COVID-19 outbreak and the new international challenges. The event was also livestreamed on multiple media outlets.
CDI and NSD scholarsshared their insights on the economic challenges faced by China in a time of global uncertainty. These panellists suggested that China needs to continue its endeavours in scientific research, technological innovation, reform of state-owned enterprises and the finance industry.
Date: December 4, 2020
Host: CDI, NSD
Theme:China’s economic outlook amid the new international challenges


Promotion of sustainable financing for the Belt and Road Initiative
Author: Guo Wanda, Executive Vice President of China Development Institute
What is Sustainable Financing
Sustainable financing refers to financing activities taking account of sustainable development criteria. It forms a financial development model that considers the coordination of humanity, society, economy and environment, and guides financial resources’ flow to more inclusive and sustainable areas.
The UN Environment first published a report in October 2015, entitled ‘Building a sustainable financial system’, which extends the field of sustainable financing to public debt, society and governance. This was further explored in November 2017, when the UN Environment and the World Bank jointly published the ’Roadmap for a Sustainable Financial System', which demonstrated how financial industries can play a different role in contemporary society by practicing sustainable financing, and engaging in social responsibilities. This report also suggests that financial technology has the potential to protect environment, and support sustainable development finance.
In February 2018, the G20 convened its Sustainable Finance Study Group (SFSG) in London. The SFSG focused on green finance as the core of their study, and also included sustainable development factors such as financial supports for disadvantaged groups, innovation and entrepreneurship, income distribution and SME development to the scope of study.
Why ‘Belt and Road Initiative’ needs sustainable financing?
Financing is essential for the Belt and Road Initiative (BRI). Based on the capital and financial needs of the BRI, a diversified, inclusive and sustainable BRI financing system has been initially established.
To enable this, the construction of diversified financing network has taken shape. The sizeable BRI financing network covers development finance, financial policy, multilateral development institutions and capital markets.
In addition, the sustainable financing policy has formed an initial framework, which has allowed a series of sustainable financing policies to take shape, and has been introduced by China and BRI countries. Some of these policies include ‘Guiding Principles on Financing the Development of BRI’, ‘A Framework to Assess Sustainability and Financial Risks under the BRI’, ‘Regulatory Commission Guidance Opinions on the Standardization of the Banking Sector’s Provision of Service to Enterprises Expanding abroad and the Strengthening of Risk Prevention and Control’ and ‘Environmental Risk Management Initiative for China's Overseas Investment’.
Moreover, sustainable financing activities are increasingly enriching, and innovative financial products and services are widely applied in the BRI countries by issuing different types of bonds; such as green ‘Belt and Road’ interbank normalization cooperative bond, green financial bond and non-sovereign secured debts.
How to promote sustainable financing for ‘Belt and Road Initiative’?
It is recommended establishing a BRI multilateral financial institution, from which lessons can be drawn within international organisations like the World Bank, the International Monetary Fund and the International Finance Corporation. The multilateral financial institution will be led by the BRI countries and will be dedicated for their financing.
More specifically, the organisations within BRI institutions will focus on some key factors; they will create and improve the sustainable financing regulation based on the BRI countries’ general agreement, they will facilitate the mandatory use of relevant sustainable financing regulations for BRI’s bilateral or multilateral financing, and will formulate the BRI sovereign debt relief mechanism, so as to cope the debt default problems involved in the BRI investment and financing. Furthermore, incorporating these mandatory sustainable financial regulations will strengthen the policy coordination among BRI countries, in areas of law, taxation, trade, investment, financial supervision and accounting standard. Thus, a transparent and non-discriminatory financing environment as well as a fair, efficient and stable financial infrastructure can be created.
Connecting business, promoting shared prosperity and sustainability in the post-Covid new economy
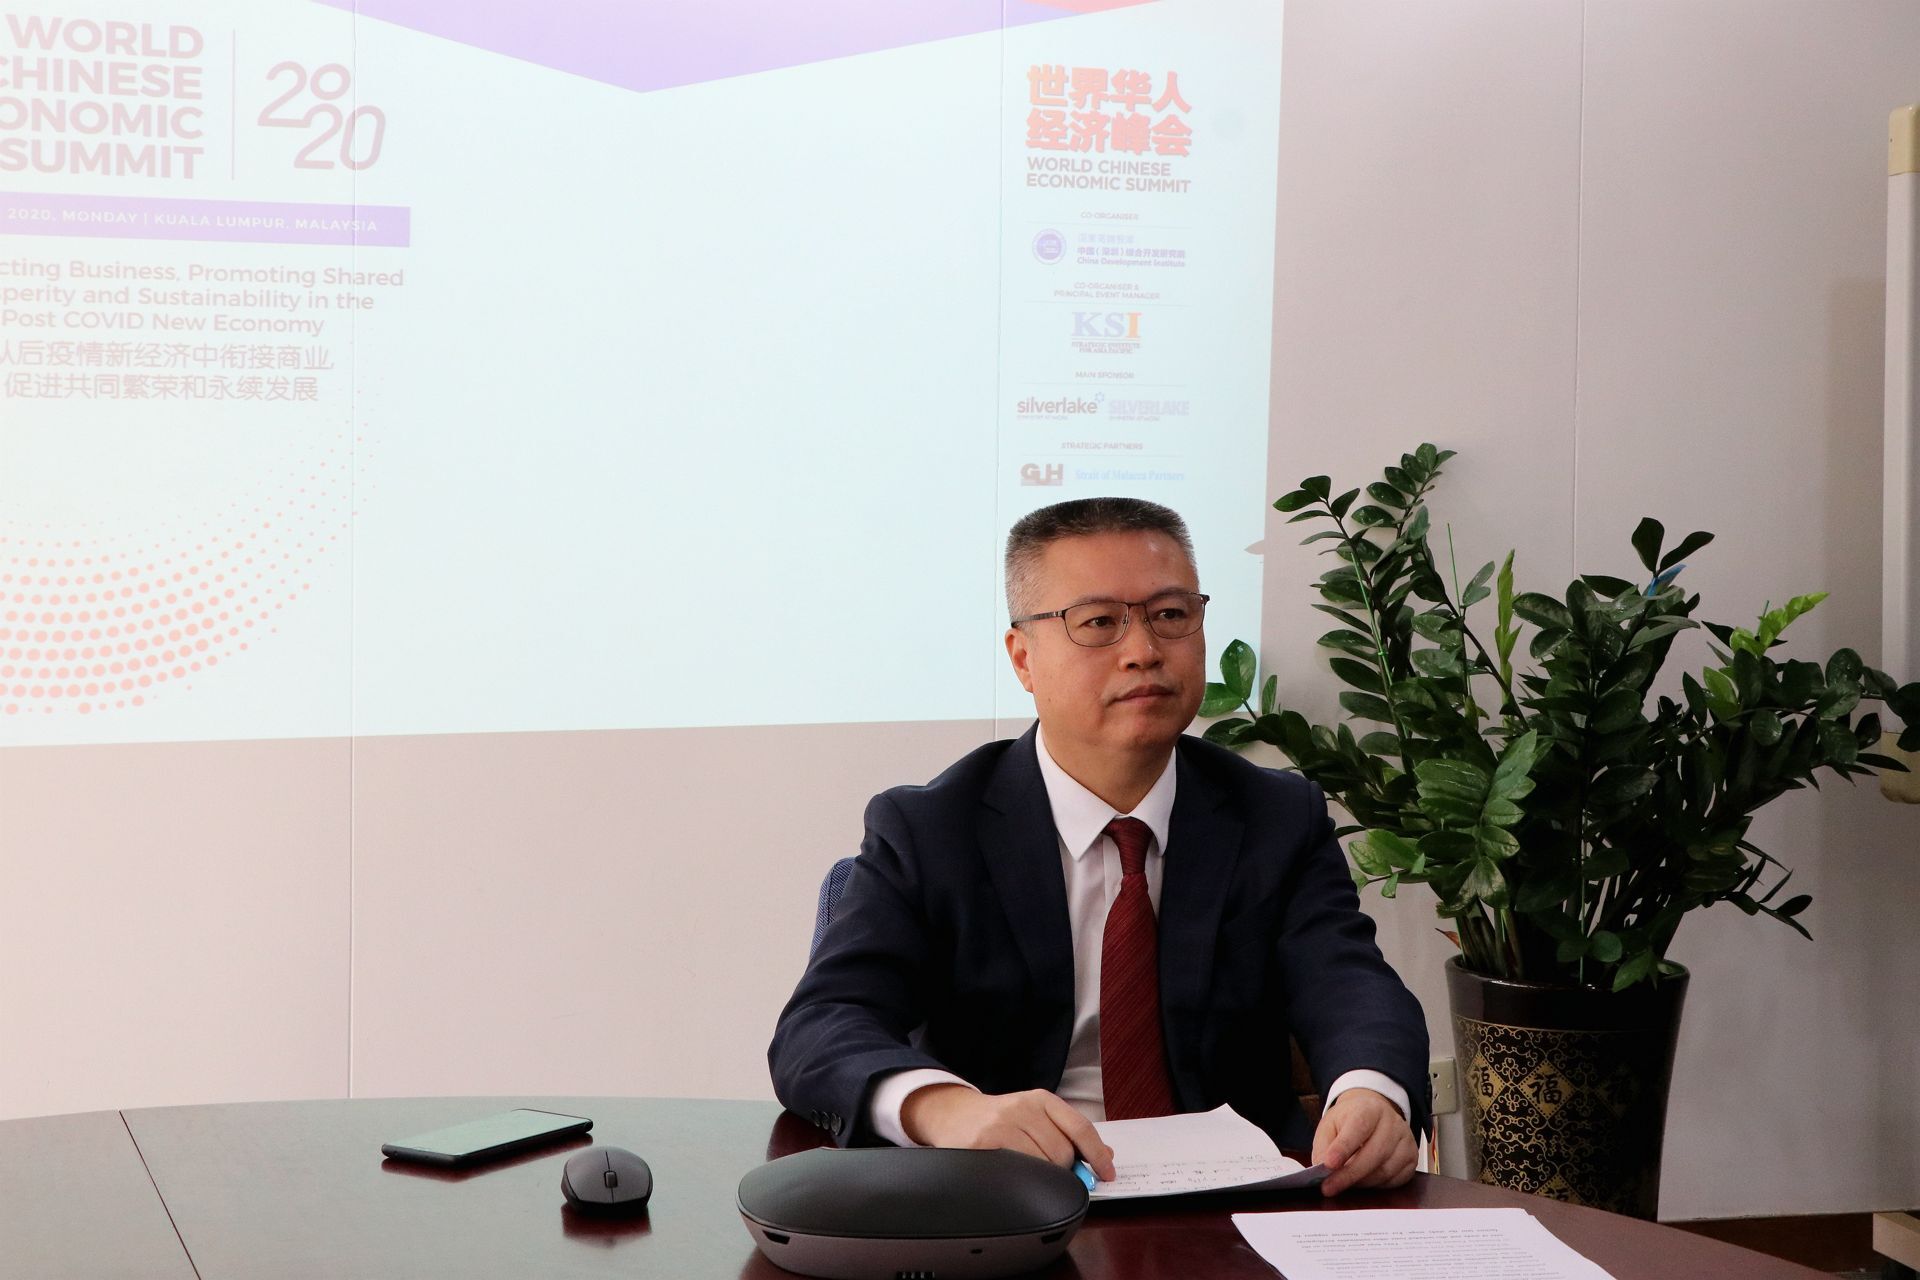
This year’s edition of World Chinese Economic Summit was held in Kuala Lumpur, Malaysia on December 21, themed “connecting business, promoting shared prosperity and sustainability in the post-Covid new economy”.Amid this winter’s resurgence of coronavirus cases, panelists agreed that international economic cooperation is pivotal and pressing even though global trade tension continues.
With a focus on economic reinvigoration and international trade and investment under the post-Covid new normal, Prof. Fan Gang, President of CDI, and Dr. Guo Wanda, Executive Vice President of CDI, spoke on China’s economic outlook and “dual circulation”, and the promotion of sustainable financing for Belt and Road Initiative.
Life after Google
Information
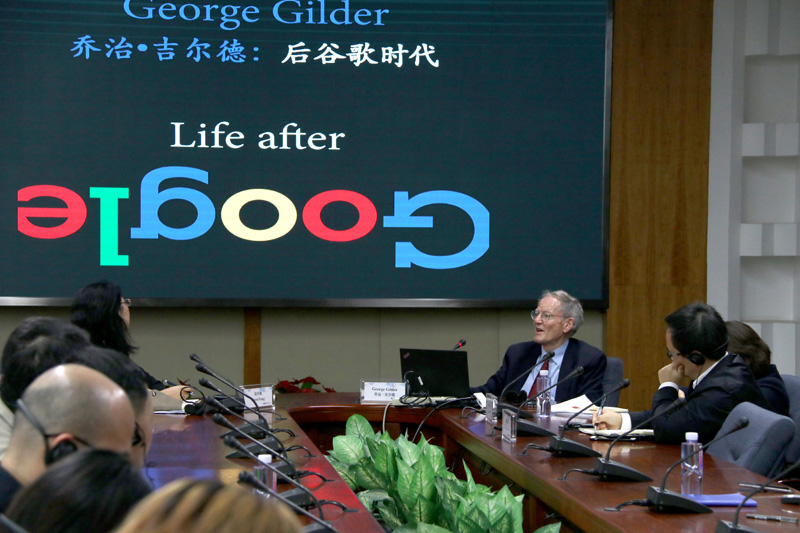
With the development of information technology and digital economy, the world economy experiences rapid growth. The Age of Google, built on big data and machine intelligence, is coming to an end. In Life after Google, what is the role of new economy during social development?
Meanwhile, the emerge of new technologies also come with unknown security and legal risks. How to cope with the opportunities and challenges?On January 11, 2019, China Development InstituteinvitedGeorge Gilder, economist and world-famous author to a seminar, themed ‘: Life after Google: meet the opportunities and challenges’, and to share insights on the trend of new economy in the life after Google.
Date: January 11, 2019
Venue: Room 101, CDI Mansion, Shenzhen
Host: CDI
Theme: Life after Google:meetthe opportunities and challenges


CDI holds China’s high-quality development of listed companies forum and launches Shenzhen Listed Companies Development Report
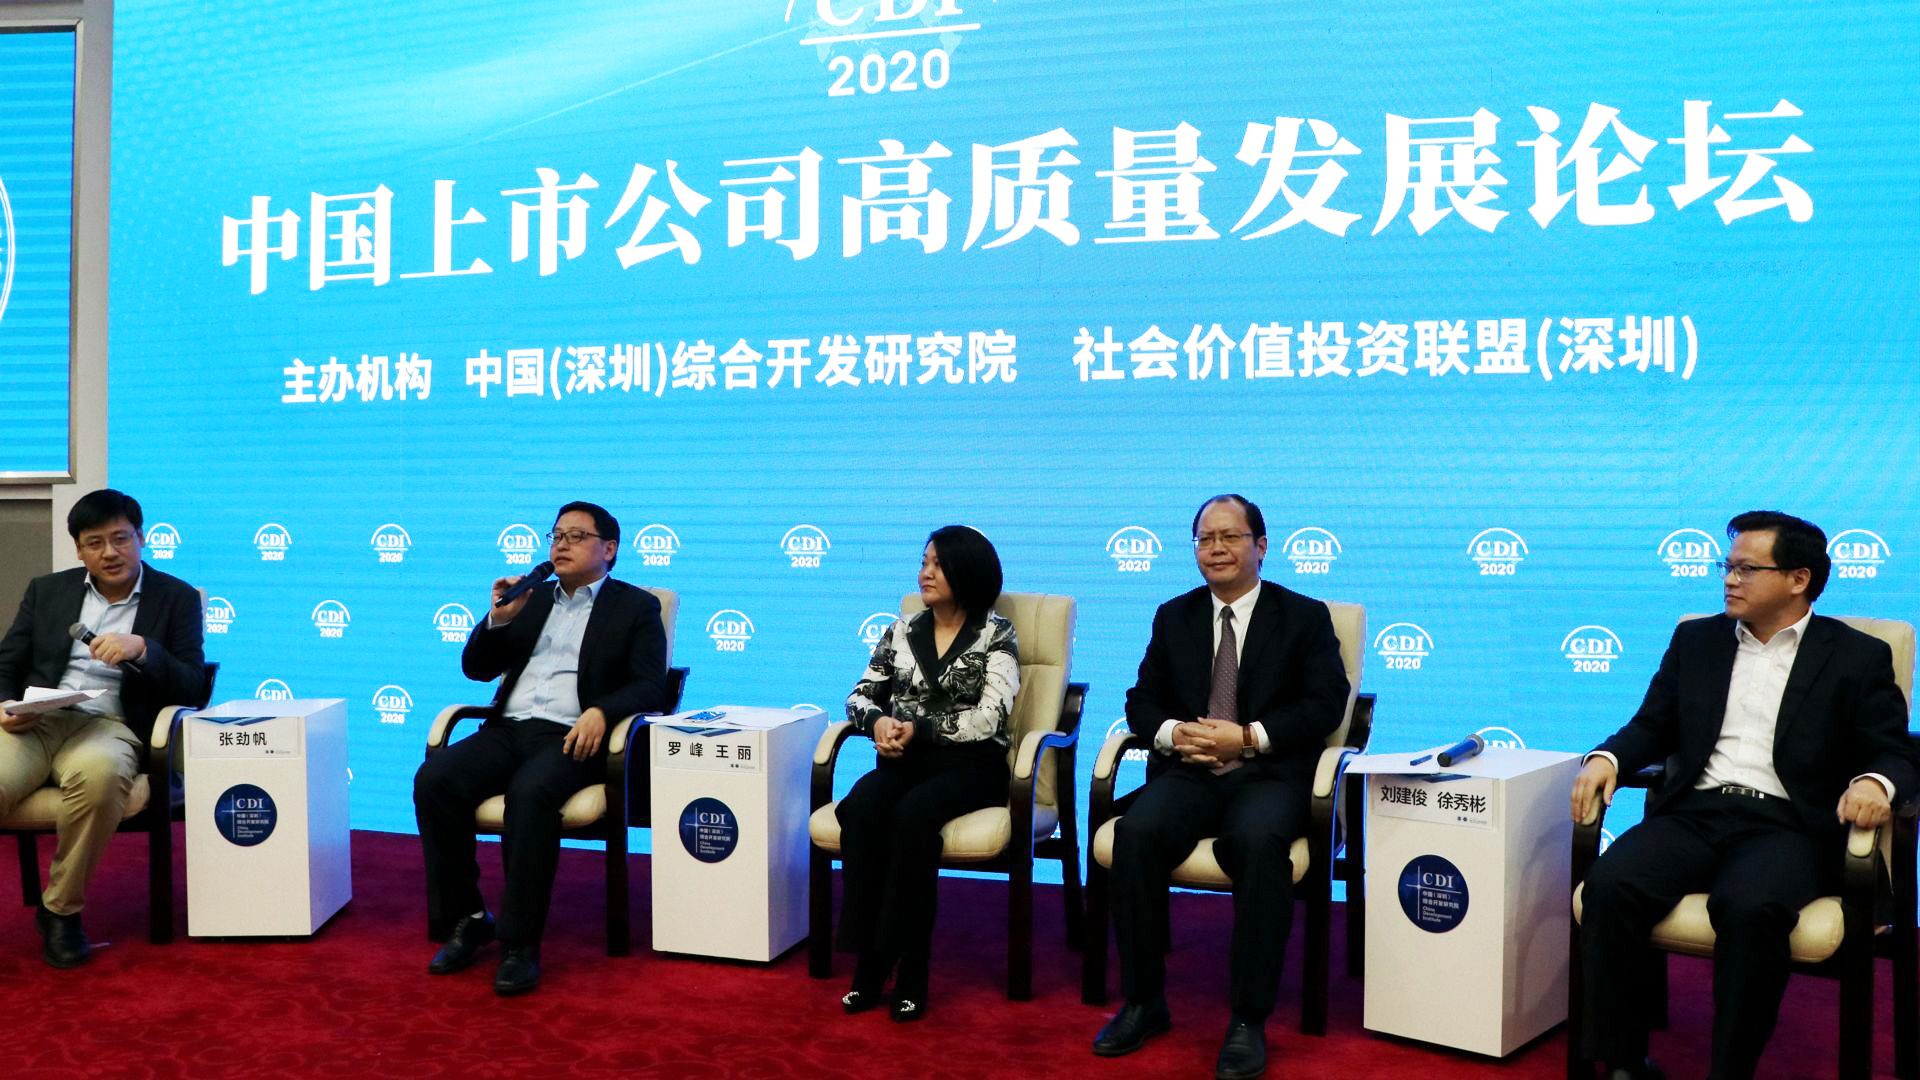
On October 9, the State Council issued a circular, outlining plans to improve the quality of listed companies, in an effort to achieve healthy development of the capital market and perfect the socialist market economic system.
Regarding to the issue, China Development Institute heldChina’s high-quality development of listed companies forum on December 9. Think tank experts, industry and business representative shared views and insights onlisted company governing, sustainable development and investing, to answer the question,how listed companies can achieve high-quality development with the utilization of capital market.
During the forum, CDI research team launched Shenzhen listed companies development report. The report reflets the status quo, characteristics and trends of the development of Shenzhen listed companies by analyzing the current problem of Shenzhen listed companies’ development.
China’s economic outlook amid international challenges
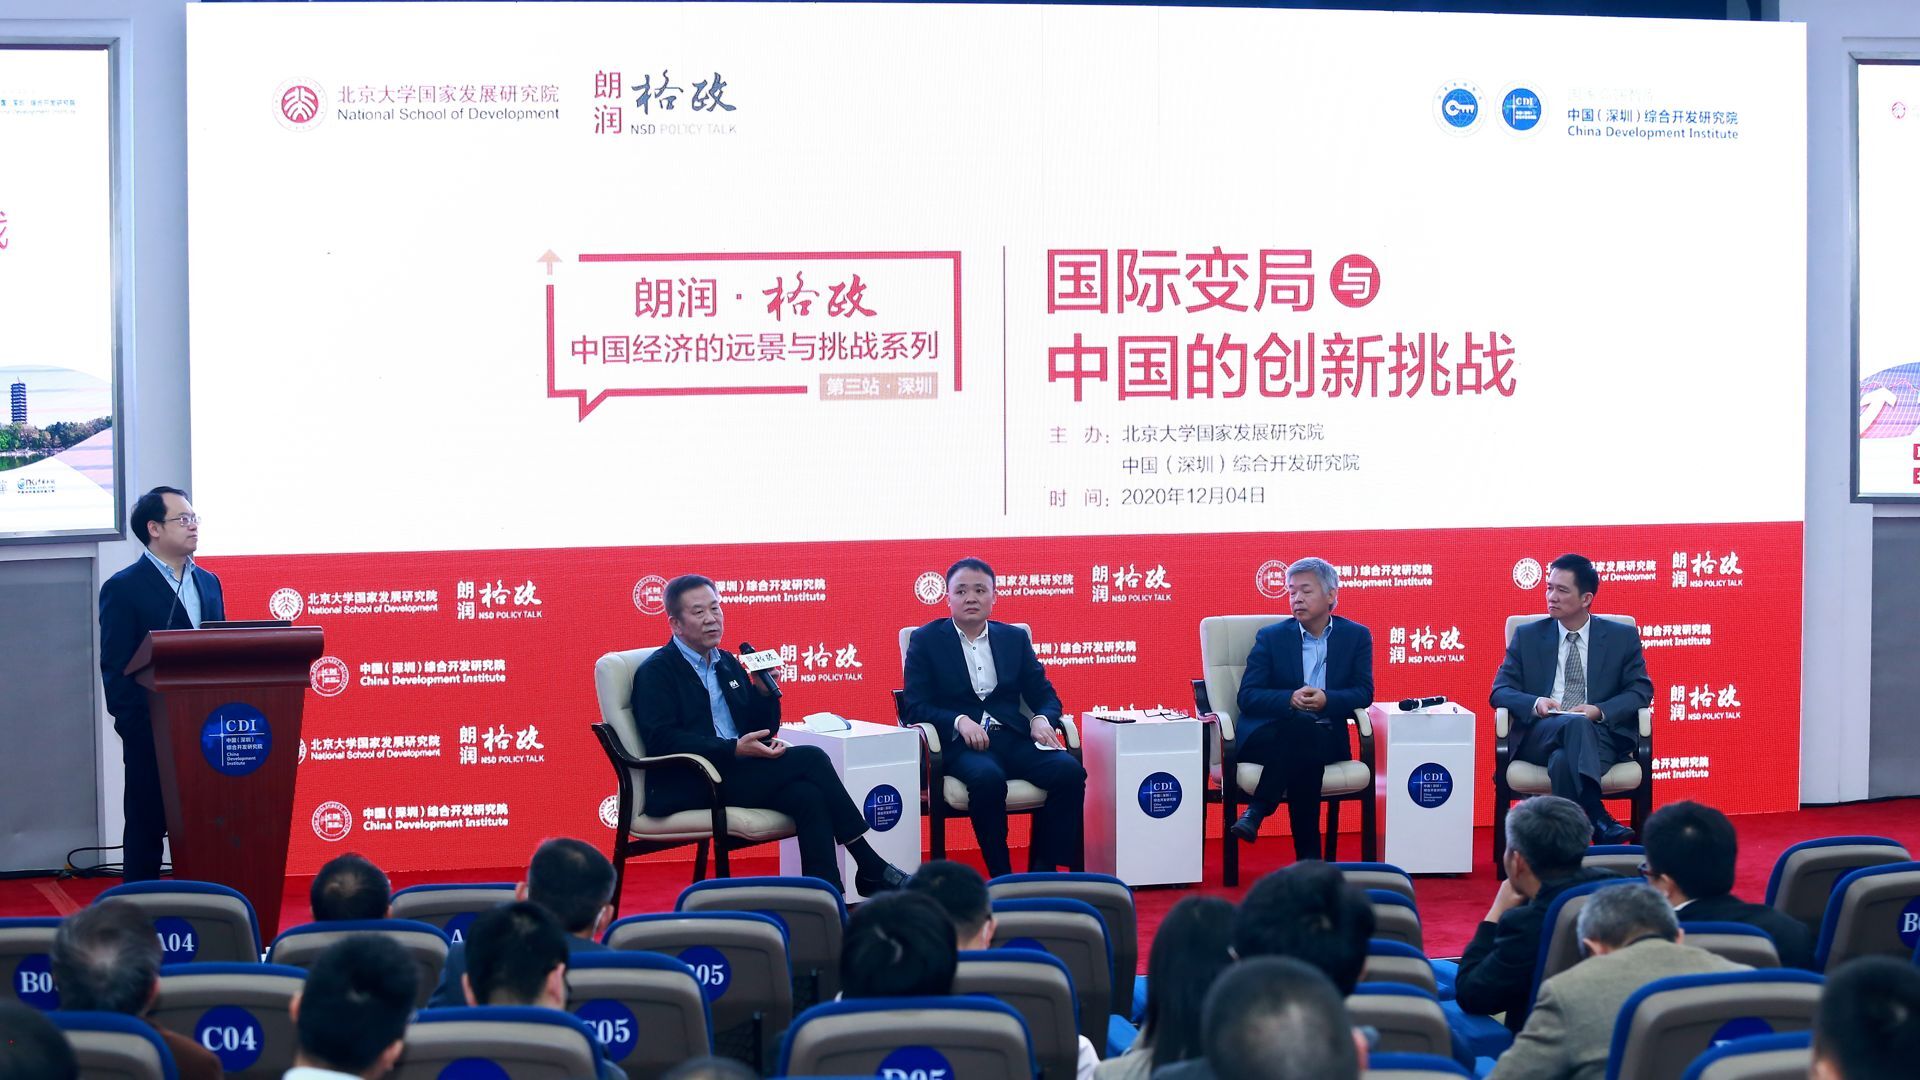
On December 4, China Development Institute and National School of Development at Peking University co-hosted the 149th NSD Policy Talk on China’s economic outlook amid the COVID-19 outbreak and new international challenges. The event was also livestreamed on multiple media outlets.
Prof. Fan Gang, President of CDI, Prof. Yao Yang, Dean of NSD, Prof. Tang Jie, former Deputy Mayor of Shenzhen, Prof. Huang Yiping, Deputy Dean of NSD, and Dr. Zheng Shilin, Research Fellow of NSD shared insights on the economic challenges that China faces in a time of global uncertainty. The panelists suggested that China needs to continue the endeavor in scientific research, technological innovation, reform of state-owned enterprises and finance industry.
CDI holds seminar on China’s financial centers development and launches China’s Financial Centers Index 12
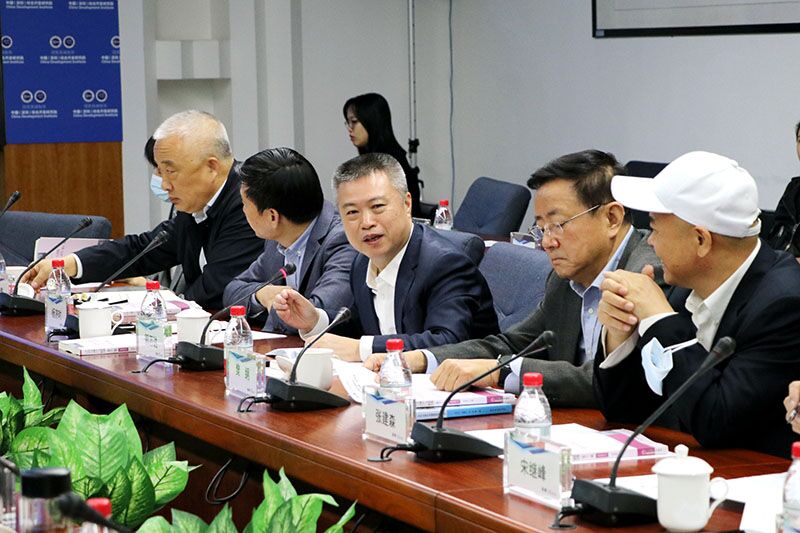
Themed “innovation, opening-up and stability”, China Development Institute held China’s financial centers development seminar in Shenzhen on December 4, 2020. Government, industry and regulatory representatives shared insights on financial regulation, as well as preventing and controlling financial risks in a time of “dual circulation”.
During the seminar, CDI research team launched China’s Financial Centers Index 12. The CDI CFCI 12 is composed of 94 factors separated into four assessment area. These are financial industry performance, financial institution strength, financial market scale and financial ecological environment. Thirty-one financial centers are included in this edition. China’s top 10 financial centers for competitiveness, according to CFCI 12, are Shanghai, Beijing, Shenzhen, Guangzhou, Hangzhou, Chengdu, Tianjin, Chongqing, Nanjing and Wuhan.
RCEP, the largest free-trade agreement deal in history

In October, industrial output rose 6.9% y/y, the same rate as in September, and the highest rate this year, up 2.2 pps from October 2019. The national service production index has been rising since the economic opening in February, and achieved positive growth in May. It rose 7.4% y/y in October, up 2 pps from September, and up 0.8 pps from October 2019. Investment rose 1.8% y/y in October, up 1 pps from September.
Retail sales of social consumption goods recovered further, and were up 4.3% y/y, and up 3.4 pps from Q3. Their real growth was 4.6% y/y, up 5 pps from Q3.Even the pandemic’s hardest-hit restaurant income has avoided a fall, and was up 0.8% y/y.
Price rises tempered amid monetary expansion. In October, CPI growth fell to only 0.5% y/y, mostly pulled down by significant meat price drops. After adjusting for seasonal factors, CPI fell -0.4% m/m. We expect CPI growth to turn from positive to negative next month, and that this will be a trend for the near future. The ex-factory price index of industrial goods fell -2.1% y/y. PPI fell -2.4% y/y. M1 rose 9.1% y/y, up 1 pps from September, and up 5.8 pps from last October, reaching its highest growth rate since February 2018.
In October, exports rose 7.6% y/y, and imports rose 0.9% y/y. Both of their seasonal adjusted growth rates show upward trends. We expect the appreciation of RMB and economic recovery to bring higher import growth.
On November 15th, 2020, 15 countries — members of the Association of Southeast Asian Nations (ASEAN), and Australia, China, Japan, South Korea and New Zealand signed the Regional Comprehensive Economic Partnership (RCEP), arguably the largest free trade agreement in history. This is the first time China has signed up to a regional multilateral trade pact. This is an example of China’s commitment to the greater openness repeatedly advocated by President Xi Jinping. While the trade deal certainly will boost these countries’ economies in the short term, in the long term it is "a victory of multilateralism and free trade," as Prime Minister Keqiang Li put it, in contrast to U.S. President Donald Trump’s trade policy.
Technology cooperation between China and UK Webinar
Information
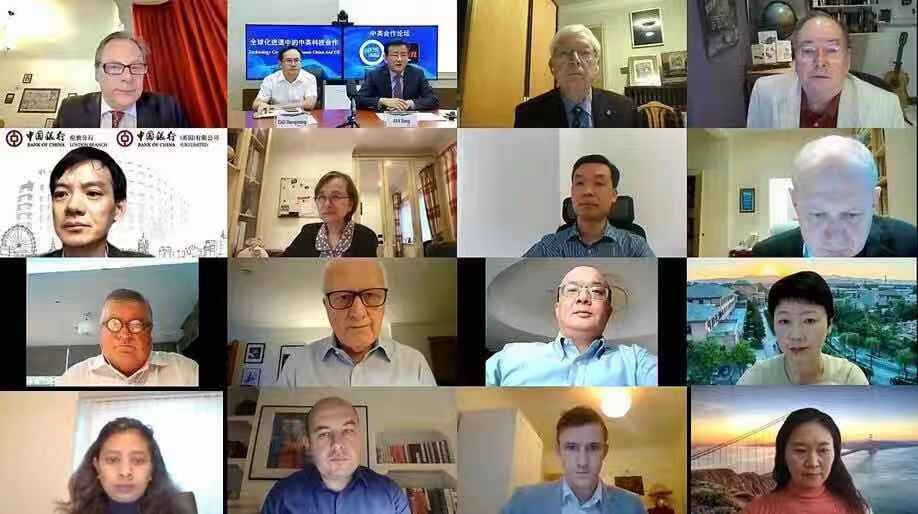
As two major economies in Asia and Europe, the cooperation between China and the UK in the field of scientific and technological innovation has maintained stable development. On October 21st, the China Development Institute and the Z/Yen jointly held a webinar. Think tank experts, government and business representatives from China and the UK have discussed strengthening exchanges and cooperation in economic, technological and other fields between the two countries in the current complex and volatile international situation.
Date:October 21, 2020
Host: CDI, Z/Yen
Theme: Technology cooperation between China and UK
Pan-Beibu Gulf Think Tank Summit 2020
Information
As COVID-19 injects uncertainty into the world economy, how can the Pan-Beibu Gulf countries advance regional industry chain and further promote economic cooperation under the Regional Comprehensive Economic Partnership (RCEP) framework, while accelerating economic recovery? The Pan-Beibu Gulf Think Tank Summit 2020 aims to provide insights of the RCEP agreement and deliver practical recommendations for business and public policy leaders.
On Oct 15, 2020, the Pan-Beibu Gulf Think Tank Summit, themed “Regional Connectivity for Shared Prosperity”, was held in Nanning, China, with international speakers attending via online conferencing system. Although global economy was impacted by the pandemic, panellists agreed that China-RCEP trade and economic cooperation uptrend is expected to continue with the integration and maximization of different modes of transportation, while boosting economic recovery and employment. Bilateral trade and investment activity will be further supported by the RCEP free trade agreement, while assuring a stable and safe local and regional supply chain. In addition, emerging industries like digital economy, maritime economy and big data could become the new drive for regional economic cooperation.
Since 2006, PBG Economic Cooperation Forum has been successfully held for 11 editions with the support of international think tanks and research institutes. Over the years, the forum has contributed significantly to China-ASEAN relation. As the parallel conclave of the PBG Economic Cooperation Forum, this year’s PBG Think Tank Summit provided a platform for sharing ideas and views among state leaders, senior government officials, business leaders and renowned scholars from China and the ASEAN countries in its 6th edition.


")
")
")
")
")
")
")
")