Signs of monetary and fiscal expansion at last

Because of the long Chinese New Year holiday, the statistics bureau only announced price, financial and PMI data in February. Producer prices grew more slowly. PPI rose 9.1% y/y, down another 1.2 pps from December. The ex-factory price index of industrial goods rose 8.85% y/y, while CPI growth also slowed. CPI rose 0.9% y/y in January, down 0.6 pps from December. In particular, food prices fell -3.8% y/y, down 2.6 pps from December, dragging CPI down 0.72 pps. That is the leading factor lowering CPI. The falling price levels offer ample room for further money expansion.
At the end of January, M2 rose 9.8% y/y, up 0.8 pps from the end of December, and up 0.4 pps from January 2020. M2 is not strongly affected by the Spring Festival effect. The significant trending upward reflects expansionary monetary policy. M1 fell -1.9% y/y. The adjusted growth rate after taking out the effect of the New Year’s holiday was around 2%. M0 rose 18.5% y/y, a major increase.
The societal financing scale increased by 6.17 trillion yuan in January, much higher than in January 2020, and market expectations. The societal financing scale increased 10.5% y/y, up 0.2 pps from December. The structural composition of societal financing is also improving. PMI fell, but was still in the improvement zone in January. In particular, PMI was 51%, down 1.2 pps from December. This indicates that the overall economic situation is good, and in an expansion zone, but the trend is slowing.
The Ministry of Finance disclosed on February 14th that to that date, some 1.788 trillion yuan ($278 billion) of this year's newly-increased debt limit of local government bonds had been allocated in advance. Of the amount already allocated, 1.46 trillion yuan is for the local government special bond quota. We expect this expansionary fiscal policy to bolster local government financing needs and investment, to ensure growth stability. The early distribution will also have a larger spillover effect for the rest of the year. The government debt ratio in China is still much lower than it in the United States, so financial risk should be containable.
Lockdown Halts Powerful Economic Recovery

The COVID-19 lockdowns in Shanghai and some other cities since late March have halted the strong economic recovery. In Q1, GDP was up 4.8% y/y, up 0.8 pps from Q4 2021, but 0.2 pps lower than in Q1 2020. Industrial output rose 6.5% in Q1, up
2.6 ppts from Q4, but down 1 pps from January-February. Investment rose 9.3% y/y in Q1, up 4.4 pps from 2021, but 2.9 pps lower than in January-February.
In March, overall PMI, manufacturing PMI, and non-manufacturing business activity PMI were 48.8%, 49.5% and 48.4% respectively, all falling steeply from the previous month, demonstrating that the economic environment has been shrinking in all dimensions.
In Q1, retail sales of consumption goods were up 3.3% y/y, down 9.2, 0.2 and 3.4 pps from 2021, this January and February respectively. In March, consumption fell -3.5% y/y; restaurant income fell -16.4% y/y, its first negative turn after more than one year.
Exports rose 13.4% y/y in Q1, down 4.6 and 0.2 pps from Q4 2021, January-February. Weak export is more because of foreign weakening demand factors, including the Russia-Ukraine war and the Fed raising rates, than because of domestic lockdowns.
In Q1, PPI rose 8.7% y/y, down 3.5 pps from Q4. Production material slowdown is the main reason for lagging PPI growth, and its growth rate was 4.8 pps, down from Q4. In Q1, CPI rose 1.1% y/y, higher than last year. In March, CPI rose 1.5% y/y, a clear rise from January and February. We expect higher CPI to persist.
Shanghai, China’s largest economic and financial center, has been under lockdown since March 27th. On April 26th, Beijing was put on Omicron alert. China's yuan fell to a one-year low, at 6.5 against a strengthening dollar on April 25th, extending losses after posting its worst week since 2015. The economy will be volatile in the near term. However, a depreciating yuan benefits export. The Chinese government is also accelerating fiscal expansion to keep the economy afloat. For example, infrastructure investment rose 8.5% y/y in Q1, up 8.1 and 0.4 pps from last year and January- February respectively.
Are Foreign Manufacturing Companies Really Moving Out of China?
Information

Date and time: 15:00-17:15, May 26, 2022 (GMT+8)
In the past four decades, China has made leap forward in its economic development, while factories in China have served as the qualified suppliers for many cross-border businesses over the years. However, changes have taken place in recent years, as labor cost in China has been increased, some of the companies want to shift production out of China to multiple sites with reduced costs. Also, with intensified competition driven by manufacturing reshoring, plus COVID pandemic, the new factor, which will make foreign companies to re-group their global sourcing strategies. A shift in global manufacturing will bring about diversified investment trend that could impact future investment patterns in the years to come.
In view of the above situation, China Development Institute is going to convene a webinar themed “Are Foreign Manufacturing Companies Really Moving Out of China”, experts from academia and business are gathered for debates in hope to share views on how the global supply chains are set to change.
Focus:
- Is China market still attractive to foreign manufacturing investment?
- Does China's manufacturing still have its advantages in global perspective?
- How you look at the trend of some foreign businesses moving manufacturing out of China, and also its implications?
- How jointly contribute to the stability in global industrial and supply chain?
Join the webinar:
https://us06web.zoom.us/webinar/register/WN_9VtTItEDTZehncKrRSaofw
* Simultaneous interpretation between English and Chinese is available for this zoom webinar
Outlook on China’s Economy: Dialogue between Fan Gang and Bert Hofman
On April 19, Prof Fan Gang, President of China Development Institute, and Prof Bert Hofman, Director of the East Asian Institute at the National University of Singapore, provided their insights on China’s economy in the hybrid talk held by the Singapore Institute of International Affairs.
- On China’s economic growth amidst the ongoing pandemic
The second quarter could see 2% growth, lower than it is expected due to the resurgence of the epidemic, which exerts negative effect on consumption, production and transportation. Collective efforts are being made across the nation in speeding up vaccination rate, building module hospitals and launching more stimulative measures, in hope to contain the pandemic and reactivate the market.
- On China’s debt issues
China’s government debt over GDP is at 46%. Comparatively, Japan is at 260%, U.S. 130%, and European countries are mostly over 100%. With enough reserve and resources, China’s debt issue is generally manageable. It is also trying to improve the efficiency of distant spending. China has announced the third pillar pension system, which is a privately supplied pension saving scheme, providing people an alternative for investment while preparing the society for an aging population.
- On China’s long-term economic outlook
Green investments in energy transition could be the next growth driver for China’s economy. Investments in urbanization will continue to be crucial, as the urbanization rate in China is still lower than that of most developing countries which shows that urban facilities and services are in great need. At the same time, as the service sector grows and consumption prices increase, China’s share of exports in GDP will begin to decline.
- On China and the regional economy
China is strongly connected with its Asian trade partners. With RCEP taking effect in 2022, China will further open up to its regional partners and with whom jointly promote regional economic growth.
Increasing Role of BRICS in Responding to the Global Economic Uncertainties
Information

Date and time: 19:00-21:00, May 12, 2022 (GMT+8)
The global economic outlook for 2022 is highly uncertain under the combined impact of global pandemic, geopolitical risks and inflation pressures, urging most economies, especially developing countries, to reexamine essential issues such as energy security, supply chain security, and financial stability.
Looking ahead, the platform BRICS, formed by world’s five major developing economies could play a key role in global economic recovery, while enabling the emerging economies to work together to cope with external risks.
In this BRICS webinar, themed “Increasing Role of BRICS in Responding to the Global Economic Uncertainties” organized by China Development Institute, experts from the five nations are gathered together for debates and discussions in hope to shed lights on the challenges faced by the BRICS and the world.
Focus:
- How should BRICS nations give full play of each one’s comparative advantage and complement one another in forming an active industrial chain?
- How should BRICS nations cooperate in building financial resilience against increasing global financial instabilities?
- In what ways could BRICS nations advance bilateral and multilateral collaboration in science, technology and innovation in facilitation of regional and global economic recovery?
* Simultaneous interpretation between English and Chinese is available for this zoom webinar
* For more details, please contact Ms. Penny Liu (pennyliu@cdi.org.cn)
Sino-Japan Dialogue on Population Aging and Countermeasures
Information

Information
According to UN report, population aging is one of the problems the world has to confront with by 2050. Being the two big countries in Asia, Japan is one of the fastest aging countries in the world, while China is getting “old but not rich”. China and Japan are both facing population aging issues, which will cause great effect on the economic and social development in both countries. Despite population aging will be a common global issue in the future, yet countries like China and Japan are at different stages of their development. Therefore, strengthening exchanges and mutual learning in the areas of coping with aging society issues will prove to be quite important for both countries in years to come.
China Development Institute (CDI), a think tank located in Southern China, will host an online webinar on "Sino-Japan Dialogue on Population Aging and Countermeasures". The event aims to gather experts and scholars from China and Japan to debate on how aging issue affects the economy, with a focus on policies and coping measures, comparisons and mutual learning in the field of population aging between China and Japan, in a bid to build capacity for addressing population aging and promoting economic and social sustainability of the two countries.
Time: 14:30-17:00, 14 April, 2022 (GMT+8, Beijing Time)
Chen Jialei

Research Assistant
Research Focus
Urban Development, Urbanization, Industrial Planning, Industrial Park
Education
Master of Science, Mid Sweden University
Projects
Outline of 14th Five-Year Plan of Humen Town Dongguan, 2020
Outline of 14th Five-Year Plan of Chang'an Town Dongguan, 2020
Outline of 14th Five-Year Plan of Wanjiang Subdistrict Dongguan, 2020
Urban Space Strategy and Industrial Development Action of Lunjiao Sub-District Foshan, 2019
Tel:+86-755-2512 4575
e-mail:cjl@cdi.org.cn
HK maintains No 3 rank among global financial centers
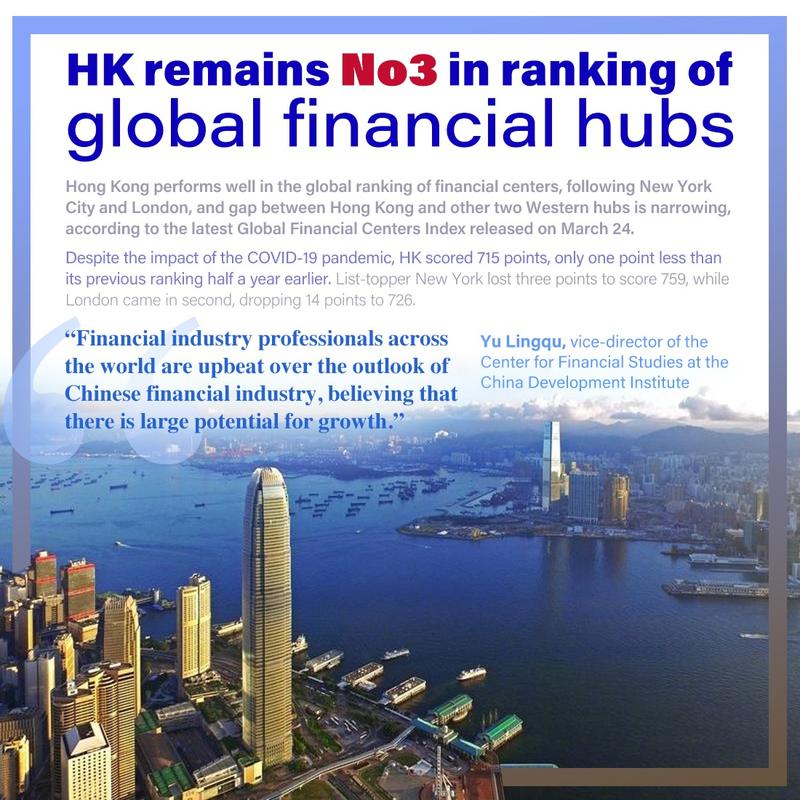
Hong Kong remained in third place in the global ranking of financial centers, following New York City and London, according to the latest Global Financial Centers Index.
Despite the impact of the COVID-19 pandemic, Hong Kong scored 715 points, only one point less than its previous ranking half a year earlier. List-topper New York lost three points to score 759, while London came in second, dropping 14 points to 726.
The GFCI was jointly published on Thursday by the China Development Institute, a Shenzhen-based think tank, and London-based think tank Z/Yen.
ALSO READ: HKSAR still a global finance center, magnet for international investors
The gap between Hong Kong and the two top Western financial centers is narrowing, said Yu Lingqu, vice-director of the Center for Financial Studies at the China Development Institute.
The semiannual ranking bases its results on the study of five areas — business environment, human capital, infrastructure, financial sector development, and reputation. The list ranked 126 financial centers worldwide.
Among the subindexes, Hong Kong ranked third in reputation globally. In the aspects of business environment, human capital, and infrastructure, the city grabbed fourth place. In financial sector development, Hong Kong ranked 11th.
Yu said financial centers on the Chinese mainland generally performed well in financial technology and reputation. “Financial industry professionals across the world are upbeat over the outlook of Chinese financial industry, believing that there is large potential for growth,” he said.
ALSO READ: ‘HK's status as global financial hub intact amid pandemic’
But he added that mainland financial centers are stronger in “hard power” than in “soft power”.
“They needs to learn from Hong Kong’s experience to further enhance their financial ‘soft power’, including business environment, human capital and infrastructure,” Yu said.
The researcher also said that the findings of the latest ranking was based on the data collected as of the end of 2021 and did not reflect the recent changes in the world’s financial situation, including the Omicron outbreak, the Russia-Ukraine conflict, and the US Federal Reserve’s interest rate hike.
“Global financial centers are facing a number of uncertainties. We need to improve risk management, create a sound business environment and strengthen cooperation between financial centers to promote better growth of the world economy,” Yu said.
READ MORE: PBOC support for HK's financial hub status solid
Shanghai ranked fourth in the GFCI, advancing two places from the previous ranking. Beijing and Shenzhen also made into the top 10 list, ranking the eighth and 10th respectively.
Los Angeles was fifth, followed by Singapore and San Francisco. Tokyo took the ninth place.
Prospect on international financial development webinar and launch of Global Financial Centres Index 31 (GFCI 31)
Information

Information
As 2022 unfolds, the global economy is faced with tremendous complications. On one hand, Covid-19 pandemic took an unexpected turn with the Omicron variant, disrupting local economy and global supply chain. On the other hand, the resulting economic and financial sanctions of the Russian-Ukraine conflict has further strained the global supply chain and amplified international financial risks. How should economies prepare themselves in terms of global financial risk management, while trying to maintain economic growth and recovery?
On March 24, 2022, China Development Institute held a webinar on the international financial development prospects, where experts provided insights on global economic landscape and opinions on counter measurements.
During this webinar, the 31st Global Financial Centres Index (GFCI 31) was jointly published by Z/Yen and CDI. GFCI 31 provides evaluations of future competitiveness and rankings for 119 financial centres around the world. The GFCI serves as a valuable reference for policy and investment decision-makers.
Date: March 24, 2022
Host: CDI
Theme: Prospect on international financial development


Signs of monetary and fiscal expansion at last
Executive summary
Because of the long Chinese New Year holiday, the statistics bureau only announced price, financial and PMI data in February. Producer prices grew more slowly. PPI rose 9.1% y/y, down another 1.2 pps from December. The ex-factory price index of industrial goods rose 8.85% y/y, while CPI growth also slowed. CPI rose 0.9% y/y in January, down 0.6 pps from December. In particular, food prices fell -3.8% y/y, down 2.6 pps from December, dragging CPI down 0.72 pps. That is the leading factor lowering CPI. The falling price levels offer ample room for further money expansion.
At the end of January, M2 rose 9.8% y/y, up 0.8 pps from the end of December, and up 0.4 pps from January 2020. M2 is not strongly affected by the Spring Festival effect. The significant trending upward reflects expansionary monetary policy. M1 fell -1.9% y/y. The adjusted growth rate after taking out the effect of the New Year’s holiday was around 2%. M0 rose 18.5% y/y, a major increase.
The societal financing scale increased by 6.17 trillion yuan in January, much higher than in January 2020, and market expectations. The societal financing scale increased 10.5% y/y, up 0.2 pps from December. The structural composition of societal financing is also improving. PMI fell, but was still in the improvement zone in January. In particular, PMI was 51%, down 1.2 pps from December. This indicates that the overall economic situation is good, and in an expansion zone, but the trend is slowing.
The Ministry of Finance disclosed on February 14th that to that date, some 1.788 trillion yuan ($278 billion) of this year's newly-increased debt limit of local government bonds had been allocated in advance. Of the amount already allocated, 1.46 trillion yuan is for the local government special bond quota. We expect this expansionary fiscal policy to bolster local government financing needs and investment, to ensure growth stability. The early distribution will also have a larger spillover effect for the rest of the year. The government debt ratio in China is still much lower than it in the United States, so financial risk should be containable.
Producer prices rose more slowly
Because of the long Chinese New Year holiday, in January (as usual), the statistics bureau only announced price, PMI index and financial data. So the analysis does not cover much. In January, PMI fell, but was still in an improvement zone. The detailed classification indicates that demand is still weak, but also suggests that market expectations are improving.
Faster money growth and societal financing scale indicate that the real economy’s financing demand has recovered. We expect fiscal policy to be intensive as well, with infrastructure projects accelerating their pace of construction. The lowering overall price level also lends a possibility for further monetary loosening. With the Spring Festival effect, part of the non-food and service categories’ price supports further CPI appreciation. But pork prices are falling significantly. The two opposite changes keep the CPI stable.
From the published data, in January, PPI rose 9.1% y/y, further down 1.2 pps from December. In particular, production material price rose 11.8% y/y, down 1.6 pps from December. Living material prices rose 0.8% y/y, down 0.2 pps.
The production material price fluctuation is the main factor driving the ex-factory price index of industrial goods. The latter rose around 8.85% y/y. Its slowdown is the main factor pushing down PPI growth.
For specific industries, main industries that saw their prices growing more slowly are coal, oil and gas, black metal mining and refinery. Those industries rose 51.3%, 38.2%, 30.1%, and 14.7% y/y, down 15.5, 7.4, 6.3, and 6.7 pps respectively.
GRAPH 1
Change in CPI and Ex-Factory Price Index of Industrial Products (y/y, %)
 Source: Chinese State Statistical Bureau
Purchasing prices of industrial producers rose 12.1% y/y, and fell -0.4% m/m. The latter’s growth rate is down more from December than the y/y growth rate, leading the ex-factory price index to fall.
The main price compositions of gas, chemical, and black metal related materials rose 30%, 17.9%, and 9.8% y/y, and fell -0.9%, -1.1%, and -0.7% m/m respectively, driving PPI had its m/m growth rate negative.
The slowdown of the ex-factory price index and PPI show that central government policies to beat down prices have been effective. The slowdown of PPI m/m growth rate led to coal mining, and black metal refinery to decrease -3.5% and -1.9% m/m, contributing to the overall industrial good price to fall. But affected by global oil and gas price increase, domestic oil and gas mining price rose 2.6%, up 9.5 pps from December. The globally dependent nature of oil and gas leads to their large fluctuations from the global factor.
CPI growth also slows
CPI rose 0.9% y/y in January, down 0.6 pps from December. In particular, food prices fell -3.8% y/y, down 2.6 pps from December, dragging down CPI around 0.72 pps. That is the leading factor lowering CPI.
Pork prices fell -41.6% y/y, because of the high base number of last year, down 4.9 pps from December, which instead is the main factor leading the food price decline. Vegetable price fell -4.1% y/y, down 14.7 pps from December. For m/m growth rates, food price rose 1.4% m/m, up 2 pps from December. The Spring Festival effect has pushed up fruit and seafood price to increase 7.2% and 4.1% m/m respectively, which are the main factor keeping up the food price.
Non-food prices rose 2% y/y, down only 0.1 pps from December. The high demand for oil and gas from the transportation demand increase due to the New Year’s holiday effect is the main contributing factor to non-food price increase. Specifically, gasoline and diesel oil prices rose 20.7% and 22.7% y/y respectively, which then contribute to industrial good price to rise 2.5% y/y.
The service price index rose 1.7% y/y, up 0.2 pps from December. This was mostly due to airfare and household related service prices rising 20.8% and 6.2% y/y.
For m/m growth rates, prices for oil, diesel oil, and gas rose 2.2%, 2.4%, and 1.5% m/m. Air tickets, transportation rental fees and long-distance coach prices rose 12.4%, 9.8%, and 5.2% m/m. House cleaning, babysitting and haircut prices rose between 2.6% and 9.1% m/m. After we take out the food and energy factors as compositions of CPI, the other prices rose 1.2% y/y overall, the same rate as in December, indicating the overall CPI growth is mild.
Signs of expansionary monetary policy
M2 was up 9.8% y/y at the end of January, up 0.8 pps from the end of December, and up 0.4 pps from January 2020. M2 is not strongly affected by the Spring Festival effect. The significant trending upward reflects expansionary monetary policy.
M1 fell -1.9% y/y. The adjusted growth rate after taking out the Spring Festival effect was around 2%. M0 rose 18.5% y/y, a large increase. What the changes of M0 and M1 reflect are the Spring Festival effect. It is customary for firms to distribute compensation and welfare in a lump-sum way to households. This leads to the transition from enterprise saving to individual savings. As seen from the data, household savings increased 5.41 trillion yuan, and non-financial enterprises savings reduced 1.4 trillion yuan. But M1 growth rate is lower than expectation probably because house purchase intention is still low in January. It is hard for household saving to transit to enterprise savings.
GRAPH 2
Change in M0, M1, and M2 (y/y, %)
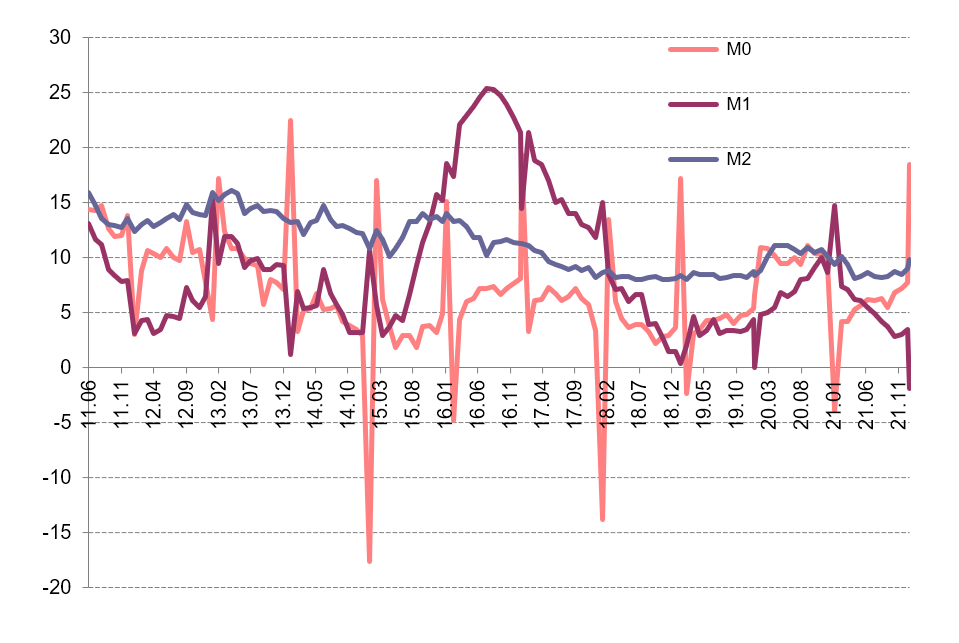
Source: Chinese State Statistical Bureau
The societal financing scale increased by 6.17 trillion yuan in January, much higher than in January 2020, and market expectations. The societal financing scale increased 10.5% y/y, up 0.2 pps from December.
The structural composition of societal financing is also improving. In particular, RMB loans under the customary societal financing standard increased 4.2 trillion yuan, 380.6 billion yuan more than last January. Government bond net financing rose 579.9 billion yuan, 188.2 billion more than last January. The aggregate of trusted loan, entrusted loan, and non-discounted bank note increased 447.9 billion yuan, 32.8 billion yuan more than last January.
Loans, corporate debt, and bank outside-balance-sheet business had major increases, except regulatory delay for government bond financing and private company to go public.
Our analysis above shows that the societal financing scale increased significantly; its composition structure also improved. Both of these show that, with all the efforts from back-to-normal monetary policy, less regulation for commercial banks, and infrastructure acceleration, monetary policy has more and more impacts on the real economy.
PMI fell, but remained in an improvement zone
Overall PMI was 51% in January, down 1.2 pps from December. This indicates that the general economic situation is good, and in an expansionary zone, but the trend is falling.
In particular, manufacturing PMI was 50.1%, down 0.2 pps from December. This is also consistent with the overall economy, which is still in an expansionary zone, but with slowing growth.
GRAPH 3
PMI Index (y/y, %)
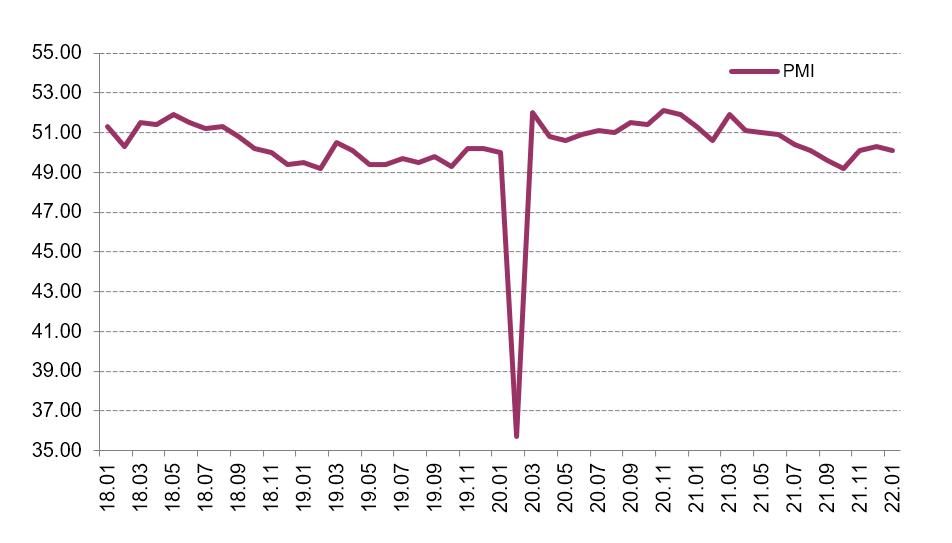
Source: CEIC data
Non-manufacturing PMI was 51.1%, down 1.6 pps from December. This is also consistent with the overall economic PMI.
For specific categories, new manufacturing orders decreased -0.4% m/m, showing weak demand. But manufacturing activity expectations, new construction orders and related activity rose 3.2, 3.3, and 0.6 m/m from December, and reached their PMI of 57.5%, 53.3%, and 57.9%, reflecting improving market expectations.
Local bond issue acceleration will keep economy stable
The Ministry of Finance disclosed on February 14th that to date, some 1.788 trillion yuan ($278 billion) of this year's newly increased debt limit of local government bonds had been allocated in advance. Of the amount already allocated, 1.46 trillion yuan is for local government’s special bond quota. We expect this expansionary fiscal policy to help local government’s financing needs and investment, to ensure growth stability. The early distribution will also have a larger spillover effect for the rest of the year. Government debt in China is still much lower than it in the United States, so financial risk should be containable.
Around the same time, on February 22nd, net onshore bond issuance by state-owned enterprises (SOEs) owned by the Henan provincial government turned positive in Q4 2021. Funding conditions stabilized after the default of Yongcheng Coal in November 2020 dampened investor appetite for securities issued by Henan SOEs in H1 2021, then reflected a return of investor confidence.
GRAPH 4
Local Government Special Bond (Billion yuan)
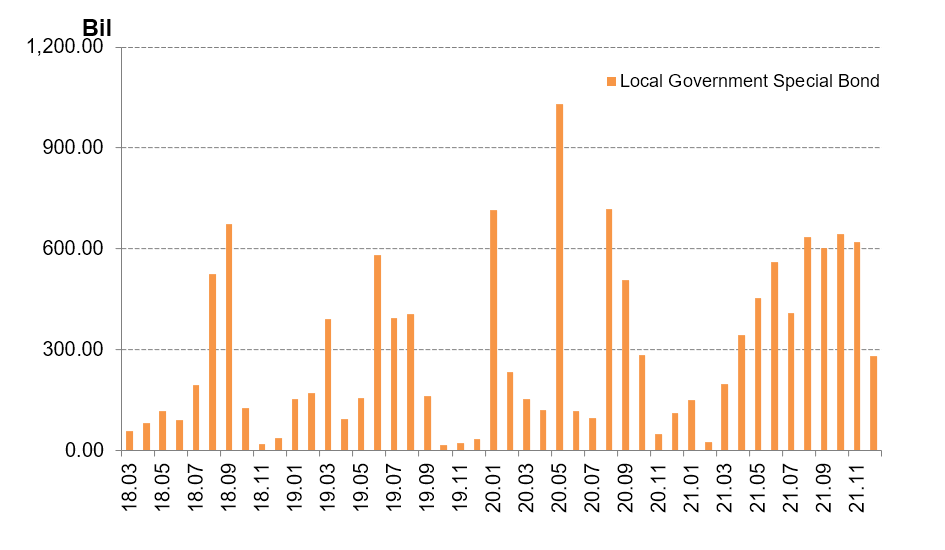
Source: National Bureau of Statistics
Although where local government special bonds will be put into use is not specifically clear, we can draw a big picture from where the bond was allocated last year, and we expect it to still be largely consistent with those fractions, as there is no specific different shock.
In 2021, half of the bond was in the area of transportation infrastructure. From the rough mention for the plan in 2022, the largest category is still transportation infrastructure. Other categories are energy, agriculture --particularly forestry and water -- environmental protection, social security and production chain infrastructure.
One concern of using these debt-driven infrastructure growth is the whole debt level and potential financial risks. The Chinese government seems to pay particular attention to this issue. All the reports have repeatedly mentioned that the financial risks need to be carefully watched. The graph below also shows that China’s debt ratios are still below those of the United States, leaving further room to add more debt. Compared to other instruments, issuing bonds can contain an inflation and asset bubble.
GRAPH 5
Debt to GDP (%)
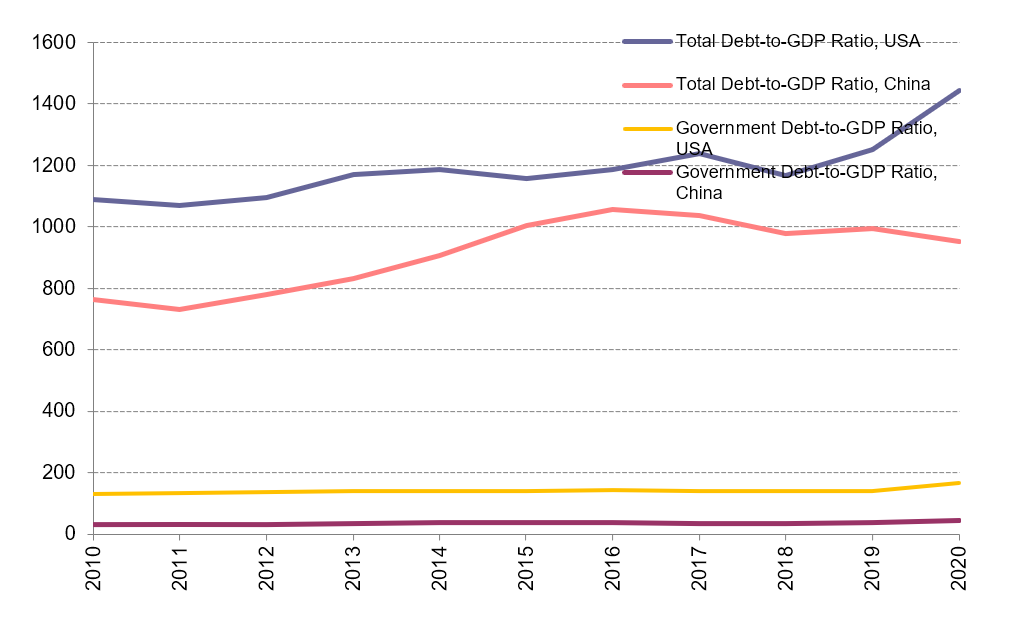
Source: National Bureau of Statistics
In our view this special bond has two different advantages over previous local government debt. If the central government simply approves any local government’s request to issue more debt, then there will be strong debt- and capital-misallocation. This is because the poorer regions will have a greater need to issue debt. However, one reason they are poor is due to their low productivity. If money is allocated to such regions, then the expected return should be lower. There will be a vicious cycle under this scenario. The financial market itself might have limited power to discipline because of its state-owned nature. Instead, currently, the central government carefully monitors the approval of these bonds, so that their efficient level should be higher.
Second, the previous local government is mainly financed by local banks. Given crony relations in small local areas, the financing is less efficient compared to the current arrangement. The national financial market that follows greater market discipline will determine bond quantity and pricing.
")
")
")
")
")
")
")
")