
2022 - Macro Outlook
Date: Nov 24, 2022
Growth is weakly recovering, with pressure ahead largely from the Covid prevention and its related lockdowns. Although there was some rumor regarding abandoning the zero-Covid policy, there were also signs that China will commit to this policy in the short term, citing reasons from state media that China’s per capita medical resource is low. We forecast that although there might be some relaxing adjustment, for example that foreign entry has reduced to five-day quarantine from seven days, the zero-Covid policy will not be abandoned soon.
In January-October, industrial output rose 4% y/y, continuing its weak recovery since May. Investment rose 5.8% y/y, down 0.1 pps from first three quarters. China’s PMI, manufactural PMI, and non-manufactural business activity index were 49%, 49.2%, and 48.7%, down 1.9, 0.9, and 1.9 pps from September.
Retail sales of social consumption goods fell -0.5% y/y, down 3 pps from September. Exports in October rose 7% y/y, down 3.7 pps from September. The global weakening demand is the main reason behind slower exports and very likely to persist in the medium term.
Economic slowdown is driving down prices. PPI fell -1.3% y/y, down 2.2 pps from September. CPI rose 2.1% y/y, down 0.7 pps from September. The global interest rate increase to combat inflation has limited Chinese central bank’s ability to cut interest rate to support the economy. Loan demand is weak. M1 rose 5.8% y/y, down 0.6 pps. M2 rose 11.8% y/y, down 0.3 pps.
On November 11th, Beijing unveiled a 16-point plan that significantly eases a crackdown on lending to the real estate sector, leading to property developers’ share instantly increase by 11%. Key measures include allowing banks to extend maturing loans to developers, supporting property sales by reducing previous sale restrictions, boosting other funding channels, and ensuring the delivery of pre-sold homes to buyers. We believe these policies will calm the market and make real estate cooling milder, but unlikely to reverse the downward trend immediately. However, real estate collapse or systemic risk can be avoided.

Growth strengthened, but only slightly. In August, industrial output rose 4.2% y/y, up 0.4 pps, lifting overall January-August growth to 3.6%, up 0.1 pps. Investment rose 5.8% y/y in January-August, up 0.1 pps. The August growth rate was 6.4% y/y, up 2.8 pps. Real estate investment growth rate fell further, to -13.8% y/y, down 1.7 pps from August 2021.
In August 2022, consumption rose 5.5% y/y, up 2.7 pps. This is partly due to the low base number of last year, when consumption rose 2.5%, and was down 6 pps from August 2021.
Exports rose 11.8% y/y, down 12.1 pps from July 2022. This seems partially because all major countries except China are exiting from monetary expansion, leading to weakened demand. This month was the first time where exports to the United States had negative growth of -3.8% y/y, dragging down total export growth by 3 pps.
PPI rose 2.3% y/y in August, down 1.9 pps. A major contributing factor is that the production material price growth rate was down 2.6 pps. CPI rose 2.5% y/y, down 0.2 pps from July. Monetary policy remained neutral. At the end of August, M0 rose 14.3% y/y, up 0.4 pps from July. M1 increased 6.1% y/y, down 0.6 pps from July. M2 rose 12.2% y/y, up 0.2 pps.
The offshore exchange rate of the Chinese yuan versus the U.S. dollar recently breached the 7:1 mark for the first time in over two years. Similar to other global currencies that have depreciated in 2022, the yuan’s decline is being driven by the strengthening of the dollar. However, the yuan “basket index” has been relatively stable, and the yuan is unlikely to see significant depreciation, given our forecast of a good balance of payments and overall macroeconomic recovery from further stimulative fiscal policy in the coming months. Other major currency determinants are also sound for the yuan, including a high position for the interest rate and foreign reserves.

Industrial output grew 3.5% y/y in January-July, up 0.1 pps from H1. In January-July, investment rose 5.7% y/y, down 0.4 pps from H1. In particular, the investment growth rate in July was down 2.4 pps from June. High infrastructure investment has been flattened by reduced real estate investment.
Retail sales of social consumption goods fell -0.2% y/y in January-July, up 0.5 pps from January-June. Exports were still strong. In July, exports rose 23.9% y/y, up 1.9 pps from June. Due to the stop of global monetary policy easing, the continuing Ukraine crisis, and the ongoing pandemic, other countries have not recovered well, giving more opportunities to Chinese companies.
PPI and CPI continued to converge. In July, the global crude oil price dropped significantly, leading the overall price level in China to fall. PPI rose 4.2% y/y, down 1.9 pps. CPI rose 2.7% y/y, up 0.2 pps from June, mainly driven by food prices. Monetary policy is easing, but at a small scale due to inflation concern. In the end of July, M0 rose 13.9% y/y, up 0.1 pps from June. M1 rose 6.7% y/y, up 0.9 pps. M2 rose 12% y/y, up 0.6 pps.
The real estate market has been cooling for over a year, and has become particularly cold. In August, China’s property sales plunged almost a third, more than during the 2008 financial crisis. Real estate investment growth fell further to -12.3%, after falling -9.4% in June and -10.1% in April. The real estate sector takes one third of GDP, and so receives much attention. We view the picture as completely different from the 2008 U.S. housing crisis. It is the Chinese government who started this real estate deleveraging, in view of potential future financial problems, and so it is largely manageable. There are also complementary policies, such as bailing out home buyers. Risk is containable, but the process is painful, and will take some time.
GDP only grew 2.5% y/y in H1. As the pandemic shock has been gradually under control and the start of various economic stabilization policies, the recovery growth in June has lifted the Q2 growth to achieve positive growth at 0.4% y/y, contributing to the path “back to normal”.
In H1, industrial output rose 3.4% y/y, down 3.1 pps from Q1. In H1, investment growth rate was 6.1% y/y, down 3.2 pps from Q1, but still 1.2 pps faster than 2021. The continuing real estate cooling does not see any time ending.
Pandemic lockdowns suppressed consumption. Retail sales of social consumption goods fell -0.7% y/y, down 4 pps from Q1. Survey data shows Chinese consumers are pessimistic about future income growth putting more constraint on future consumption recovery. In H1, exports rose 13.2% y/y. In June alone, exports rose 22% y/y, accelerating since April, and is an important force lifting economic recovery.
In H1, PPI rose 7.7% y/y. CPI increased 1.7% y/y. Low inflation benefits from the recovery of supply chains, domestically and internationally. However, future inflation pressure is still high. The main financial indicators were loosened somewhat countercyclically. At the end of June, M2 rose 11.4% y/y, up 0.3 pps from May, and up 1.7 pps from Q1, slowly picking up. M1 rose 5.8% y/y, up 1.2 pps from May, and up 1.1 pps from Q1.
China’s unemployment situation is worsening. According to the National Bureau of Statistics, the government official source, China’s youth unemployment rate for ages from 18 to 24 hit an all-time high of 19.3% in June. It was a sharp rise from 18.4% in May and marked a year-on-year increase of 25%. We believe the unemployment might not pose a society crisis. Parents in China usually provide living net. The unemployment leans more to friction cause. For example, many campus recruitments were suspended because of the pandemic.
Government will continue its effort to bring the economic activities to a higher level. However, it seems not necessary for China to stimulate the economy by additional measures. On July 20th, China’s Prime Minister Li Keqiang stated that China will not adopt large stimulus policies.

Because of the long Chinese New Year holiday, the statistics bureau only announced price, financial and PMI data in February. Producer prices grew more slowly. PPI rose 9.1% y/y, down another 1.2 pps from December. The ex-factory price index of industrial goods rose 8.85% y/y, while CPI growth also slowed. CPI rose 0.9% y/y in January, down 0.6 pps from December. In particular, food prices fell -3.8% y/y, down 2.6 pps from December, dragging CPI down 0.72 pps. That is the leading factor lowering CPI. The falling price levels offer ample room for further money expansion.
At the end of January, M2 rose 9.8% y/y, up 0.8 pps from the end of December, and up 0.4 pps from January 2020. M2 is not strongly affected by the Spring Festival effect. The significant trending upward reflects expansionary monetary policy. M1 fell -1.9% y/y. The adjusted growth rate after taking out the effect of the New Year’s holiday was around 2%. M0 rose 18.5% y/y, a major increase.
The societal financing scale increased by 6.17 trillion yuan in January, much higher than in January 2020, and market expectations. The societal financing scale increased 10.5% y/y, up 0.2 pps from December. The structural composition of societal financing is also improving. PMI fell, but was still in the improvement zone in January. In particular, PMI was 51%, down 1.2 pps from December. This indicates that the overall economic situation is good, and in an expansion zone, but the trend is slowing.
The Ministry of Finance disclosed on February 14th that to that date, some 1.788 trillion yuan ($278 billion) of this year's newly-increased debt limit of local government bonds had been allocated in advance. Of the amount already allocated, 1.46 trillion yuan is for the local government special bond quota. We expect this expansionary fiscal policy to bolster local government financing needs and investment, to ensure growth stability. The early distribution will also have a larger spillover effect for the rest of the year. The government debt ratio in China is still much lower than it in the United States, so financial risk should be containable.

The COVID-19 lockdowns in Shanghai and some other cities since late March have halted the strong economic recovery. In Q1, GDP was up 4.8% y/y, up 0.8 pps from Q4 2021, but 0.2 pps lower than in Q1 2020. Industrial output rose 6.5% in Q1, up
2.6 ppts from Q4, but down 1 pps from January-February. Investment rose 9.3% y/y in Q1, up 4.4 pps from 2021, but 2.9 pps lower than in January-February.
In March, overall PMI, manufacturing PMI, and non-manufacturing business activity PMI were 48.8%, 49.5% and 48.4% respectively, all falling steeply from the previous month, demonstrating that the economic environment has been shrinking in all dimensions.
In Q1, retail sales of consumption goods were up 3.3% y/y, down 9.2, 0.2 and 3.4 pps from 2021, this January and February respectively. In March, consumption fell -3.5% y/y; restaurant income fell -16.4% y/y, its first negative turn after more than one year.
Exports rose 13.4% y/y in Q1, down 4.6 and 0.2 pps from Q4 2021, January-February. Weak export is more because of foreign weakening demand factors, including the Russia-Ukraine war and the Fed raising rates, than because of domestic lockdowns.
In Q1, PPI rose 8.7% y/y, down 3.5 pps from Q4. Production material slowdown is the main reason for lagging PPI growth, and its growth rate was 4.8 pps, down from Q4. In Q1, CPI rose 1.1% y/y, higher than last year. In March, CPI rose 1.5% y/y, a clear rise from January and February. We expect higher CPI to persist.
Shanghai, China’s largest economic and financial center, has been under lockdown since March 27th. On April 26th, Beijing was put on Omicron alert. China's yuan fell to a one-year low, at 6.5 against a strengthening dollar on April 25th, extending losses after posting its worst week since 2015. The economy will be volatile in the near term. However, a depreciating yuan benefits export. The Chinese government is also accelerating fiscal expansion to keep the economy afloat. For example, infrastructure investment rose 8.5% y/y in Q1, up 8.1 and 0.4 pps from last year and January- February respectively.
Executive summary
Because of the long Chinese New Year holiday, the statistics bureau only announced price, financial and PMI data in February. Producer prices grew more slowly. PPI rose 9.1% y/y, down another 1.2 pps from December. The ex-factory price index of industrial goods rose 8.85% y/y, while CPI growth also slowed. CPI rose 0.9% y/y in January, down 0.6 pps from December. In particular, food prices fell -3.8% y/y, down 2.6 pps from December, dragging CPI down 0.72 pps. That is the leading factor lowering CPI. The falling price levels offer ample room for further money expansion.
At the end of January, M2 rose 9.8% y/y, up 0.8 pps from the end of December, and up 0.4 pps from January 2020. M2 is not strongly affected by the Spring Festival effect. The significant trending upward reflects expansionary monetary policy. M1 fell -1.9% y/y. The adjusted growth rate after taking out the effect of the New Year’s holiday was around 2%. M0 rose 18.5% y/y, a major increase.
The societal financing scale increased by 6.17 trillion yuan in January, much higher than in January 2020, and market expectations. The societal financing scale increased 10.5% y/y, up 0.2 pps from December. The structural composition of societal financing is also improving. PMI fell, but was still in the improvement zone in January. In particular, PMI was 51%, down 1.2 pps from December. This indicates that the overall economic situation is good, and in an expansion zone, but the trend is slowing.
The Ministry of Finance disclosed on February 14th that to that date, some 1.788 trillion yuan ($278 billion) of this year's newly-increased debt limit of local government bonds had been allocated in advance. Of the amount already allocated, 1.46 trillion yuan is for the local government special bond quota. We expect this expansionary fiscal policy to bolster local government financing needs and investment, to ensure growth stability. The early distribution will also have a larger spillover effect for the rest of the year. The government debt ratio in China is still much lower than it in the United States, so financial risk should be containable.
Producer prices rose more slowly
Because of the long Chinese New Year holiday, in January (as usual), the statistics bureau only announced price, PMI index and financial data. So the analysis does not cover much. In January, PMI fell, but was still in an improvement zone. The detailed classification indicates that demand is still weak, but also suggests that market expectations are improving.
Faster money growth and societal financing scale indicate that the real economy’s financing demand has recovered. We expect fiscal policy to be intensive as well, with infrastructure projects accelerating their pace of construction. The lowering overall price level also lends a possibility for further monetary loosening. With the Spring Festival effect, part of the non-food and service categories’ price supports further CPI appreciation. But pork prices are falling significantly. The two opposite changes keep the CPI stable.
From the published data, in January, PPI rose 9.1% y/y, further down 1.2 pps from December. In particular, production material price rose 11.8% y/y, down 1.6 pps from December. Living material prices rose 0.8% y/y, down 0.2 pps.
The production material price fluctuation is the main factor driving the ex-factory price index of industrial goods. The latter rose around 8.85% y/y. Its slowdown is the main factor pushing down PPI growth.
For specific industries, main industries that saw their prices growing more slowly are coal, oil and gas, black metal mining and refinery. Those industries rose 51.3%, 38.2%, 30.1%, and 14.7% y/y, down 15.5, 7.4, 6.3, and 6.7 pps respectively.
GRAPH 1
Change in CPI and Ex-Factory Price Index of Industrial Products (y/y, %)
 Source: Chinese State Statistical Bureau
Purchasing prices of industrial producers rose 12.1% y/y, and fell -0.4% m/m. The latter’s growth rate is down more from December than the y/y growth rate, leading the ex-factory price index to fall.
The main price compositions of gas, chemical, and black metal related materials rose 30%, 17.9%, and 9.8% y/y, and fell -0.9%, -1.1%, and -0.7% m/m respectively, driving PPI had its m/m growth rate negative.
The slowdown of the ex-factory price index and PPI show that central government policies to beat down prices have been effective. The slowdown of PPI m/m growth rate led to coal mining, and black metal refinery to decrease -3.5% and -1.9% m/m, contributing to the overall industrial good price to fall. But affected by global oil and gas price increase, domestic oil and gas mining price rose 2.6%, up 9.5 pps from December. The globally dependent nature of oil and gas leads to their large fluctuations from the global factor.
CPI growth also slows
CPI rose 0.9% y/y in January, down 0.6 pps from December. In particular, food prices fell -3.8% y/y, down 2.6 pps from December, dragging down CPI around 0.72 pps. That is the leading factor lowering CPI.
Pork prices fell -41.6% y/y, because of the high base number of last year, down 4.9 pps from December, which instead is the main factor leading the food price decline. Vegetable price fell -4.1% y/y, down 14.7 pps from December. For m/m growth rates, food price rose 1.4% m/m, up 2 pps from December. The Spring Festival effect has pushed up fruit and seafood price to increase 7.2% and 4.1% m/m respectively, which are the main factor keeping up the food price.
Non-food prices rose 2% y/y, down only 0.1 pps from December. The high demand for oil and gas from the transportation demand increase due to the New Year’s holiday effect is the main contributing factor to non-food price increase. Specifically, gasoline and diesel oil prices rose 20.7% and 22.7% y/y respectively, which then contribute to industrial good price to rise 2.5% y/y.
The service price index rose 1.7% y/y, up 0.2 pps from December. This was mostly due to airfare and household related service prices rising 20.8% and 6.2% y/y.
For m/m growth rates, prices for oil, diesel oil, and gas rose 2.2%, 2.4%, and 1.5% m/m. Air tickets, transportation rental fees and long-distance coach prices rose 12.4%, 9.8%, and 5.2% m/m. House cleaning, babysitting and haircut prices rose between 2.6% and 9.1% m/m. After we take out the food and energy factors as compositions of CPI, the other prices rose 1.2% y/y overall, the same rate as in December, indicating the overall CPI growth is mild.
Signs of expansionary monetary policy
M2 was up 9.8% y/y at the end of January, up 0.8 pps from the end of December, and up 0.4 pps from January 2020. M2 is not strongly affected by the Spring Festival effect. The significant trending upward reflects expansionary monetary policy.
M1 fell -1.9% y/y. The adjusted growth rate after taking out the Spring Festival effect was around 2%. M0 rose 18.5% y/y, a large increase. What the changes of M0 and M1 reflect are the Spring Festival effect. It is customary for firms to distribute compensation and welfare in a lump-sum way to households. This leads to the transition from enterprise saving to individual savings. As seen from the data, household savings increased 5.41 trillion yuan, and non-financial enterprises savings reduced 1.4 trillion yuan. But M1 growth rate is lower than expectation probably because house purchase intention is still low in January. It is hard for household saving to transit to enterprise savings.
GRAPH 2
Change in M0, M1, and M2 (y/y, %)
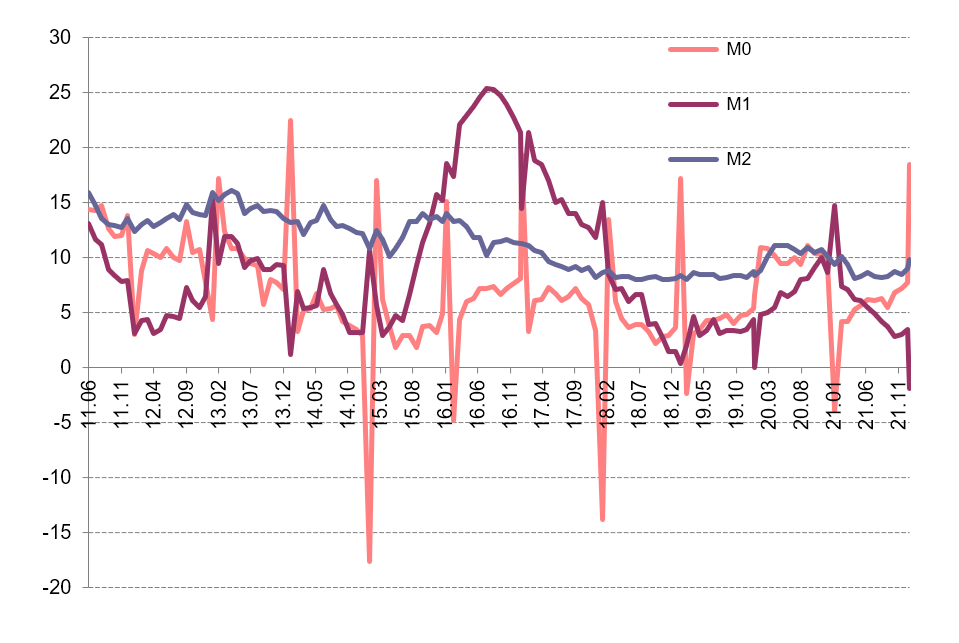
Source: Chinese State Statistical Bureau
The societal financing scale increased by 6.17 trillion yuan in January, much higher than in January 2020, and market expectations. The societal financing scale increased 10.5% y/y, up 0.2 pps from December.
The structural composition of societal financing is also improving. In particular, RMB loans under the customary societal financing standard increased 4.2 trillion yuan, 380.6 billion yuan more than last January. Government bond net financing rose 579.9 billion yuan, 188.2 billion more than last January. The aggregate of trusted loan, entrusted loan, and non-discounted bank note increased 447.9 billion yuan, 32.8 billion yuan more than last January.
Loans, corporate debt, and bank outside-balance-sheet business had major increases, except regulatory delay for government bond financing and private company to go public.
Our analysis above shows that the societal financing scale increased significantly; its composition structure also improved. Both of these show that, with all the efforts from back-to-normal monetary policy, less regulation for commercial banks, and infrastructure acceleration, monetary policy has more and more impacts on the real economy.
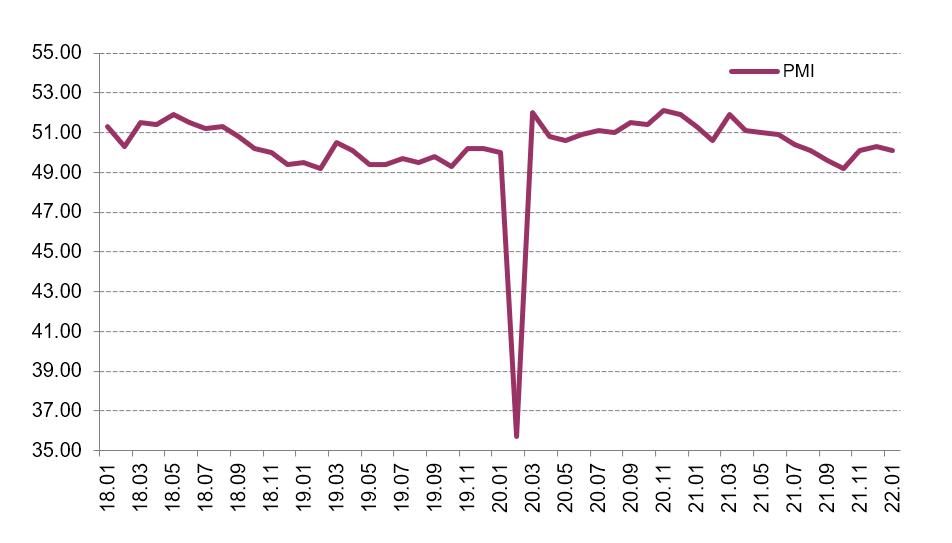
PMI fell, but remained in an improvement zone
Overall PMI was 51% in January, down 1.2 pps from December. This indicates that the general economic situation is good, and in an expansionary zone, but the trend is falling.
In particular, manufacturing PMI was 50.1%, down 0.2 pps from December. This is also consistent with the overall economy, which is still in an expansionary zone, but with slowing growth.
GRAPH 3
PMI Index (y/y, %)
Source: CEIC data
Non-manufacturing PMI was 51.1%, down 1.6 pps from December. This is also consistent with the overall economic PMI.
For specific categories, new manufacturing orders decreased -0.4% m/m, showing weak demand. But manufacturing activity expectations, new construction orders and related activity rose 3.2, 3.3, and 0.6 m/m from December, and reached their PMI of 57.5%, 53.3%, and 57.9%, reflecting improving market expectations.
Local bond issue acceleration will keep economy stable
The Ministry of Finance disclosed on February 14th that to date, some 1.788 trillion yuan ($278 billion) of this year's newly increased debt limit of local government bonds had been allocated in advance. Of the amount already allocated, 1.46 trillion yuan is for local government’s special bond quota. We expect this expansionary fiscal policy to help local government’s financing needs and investment, to ensure growth stability. The early distribution will also have a larger spillover effect for the rest of the year. Government debt in China is still much lower than it in the United States, so financial risk should be containable.
Around the same time, on February 22nd, net onshore bond issuance by state-owned enterprises (SOEs) owned by the Henan provincial government turned positive in Q4 2021. Funding conditions stabilized after the default of Yongcheng Coal in November 2020 dampened investor appetite for securities issued by Henan SOEs in H1 2021, then reflected a return of investor confidence.
GRAPH 4
Local Government Special Bond (Billion yuan)
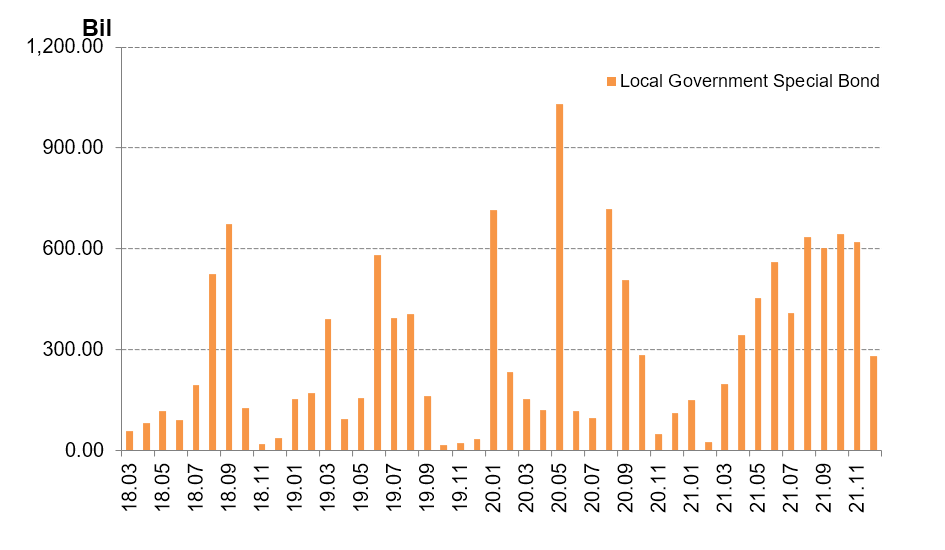
Source: National Bureau of Statistics
Although where local government special bonds will be put into use is not specifically clear, we can draw a big picture from where the bond was allocated last year, and we expect it to still be largely consistent with those fractions, as there is no specific different shock.
In 2021, half of the bond was in the area of transportation infrastructure. From the rough mention for the plan in 2022, the largest category is still transportation infrastructure. Other categories are energy, agriculture --particularly forestry and water -- environmental protection, social security and production chain infrastructure.
One concern of using these debt-driven infrastructure growth is the whole debt level and potential financial risks. The Chinese government seems to pay particular attention to this issue. All the reports have repeatedly mentioned that the financial risks need to be carefully watched. The graph below also shows that China’s debt ratios are still below those of the United States, leaving further room to add more debt. Compared to other instruments, issuing bonds can contain an inflation and asset bubble.
GRAPH 5
Debt to GDP (%)
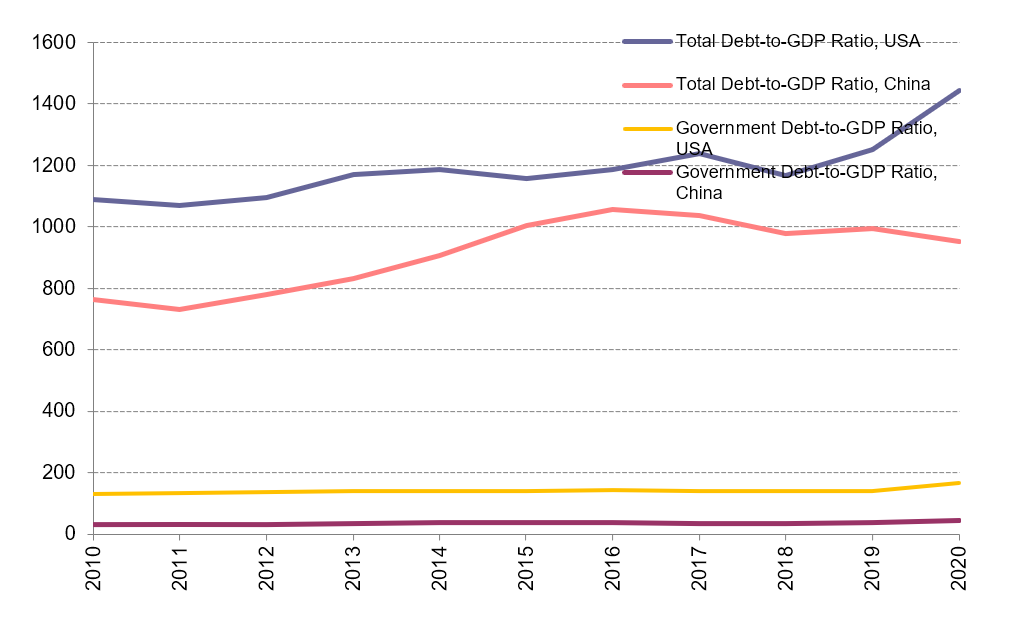
Source: National Bureau of Statistics
In our view this special bond has two different advantages over previous local government debt. If the central government simply approves any local government’s request to issue more debt, then there will be strong debt- and capital-misallocation. This is because the poorer regions will have a greater need to issue debt. However, one reason they are poor is due to their low productivity. If money is allocated to such regions, then the expected return should be lower. There will be a vicious cycle under this scenario. The financial market itself might have limited power to discipline because of its state-owned nature. Instead, currently, the central government carefully monitors the approval of these bonds, so that their efficient level should be higher.
Second, the previous local government is mainly financed by local banks. Given crony relations in small local areas, the financing is less efficient compared to the current arrangement. The national financial market that follows greater market discipline will determine bond quantity and pricing.
")
")
")
")
")
")
")
")