Economy Sustains Positive Momentum With Targeted Policy Support
Date: December 20, 2024
In November, the combined effects of macroeconomic policies became more evident. The acceleration of export growth boosted industrial chains, while policies promoting large-scale equipment upgrades and consumer goods trade-ins bolstered manufacturing demand and investment. Infrastructure investment, though slightly decelerating, demonstrated resilience due to the effective execution of existing policies and the accelerated implementation of new measures. Concurrently, strengthened real estate support policies increased transaction volumes; nonetheless, achieving full stabilization requires further recovery in income expectations on the demand side. On the whole, macroeconomic policies are yielding tangible benefits, with key sectors exhibiting promising signs of recovery.
Economic Expansion Gains Further Momentum
In November, the Composite PMI Output Index remained steady at 50.8%, indicating sustained economic growth. The Manufacturing PMI increased to 50.3%, with the Production Index and New Orders Index rising to 52.4% and 50.8%, respectively. Notably, new orders returned to growth for the first time since May, indicating increased demand and market activity. However, the non-manufacturing sector saw mounting pressure as the Business Activity Index dipped to 50.0%. Service output growth moderated slightly to 6.1% year-on-year, down 0.2 percentage points from October.
Exports Remain Stable Amid Fluctuations
From January to November, goods exports increased by 6.7% year-on-year, aligning with the January–October growth rate, indicating strong overall resilience. While November's growth rate decreased by 6 percentage points to 6.7%, it remained among the highest levels this year. Key drivers were front-loading effects and sustained strong demand from the U.S. and ASEAN markets, with U.S. exports surpassing those to Europe. Holiday demand for toys and communication equipment notably enhanced U.S. export growth. However, the EU’s tariffs on electric vehicles tempered gains in the automotive supply chain.
Manufacturing Drives Steady Industrial Growth
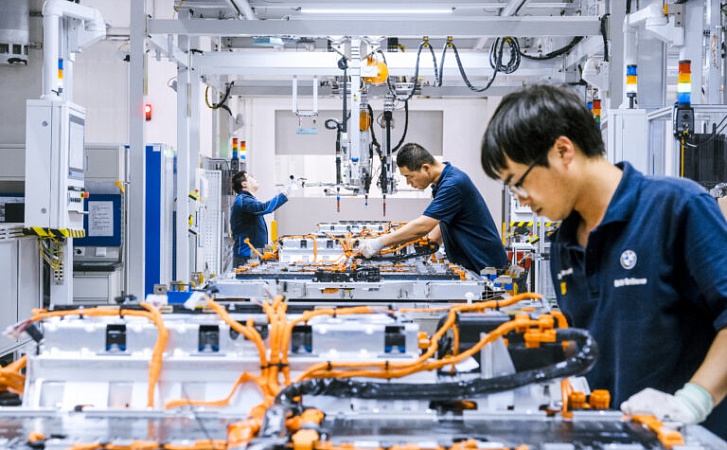
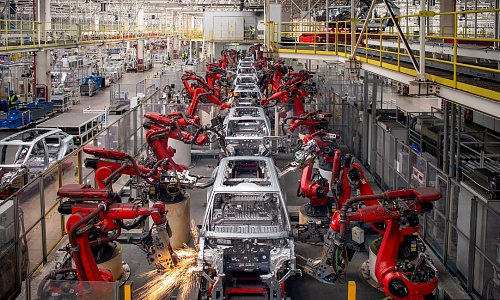
From January to November, large-scale industrial output increased 5.8% year-on-year, with November seeing an acceleration of 5.4%. Manufacturing increased by 6.0%, marking its third consecutive month of growth and solidifying its position as the primary driver. Conversely, mining and utilities experienced a slight slowdown from the previous month. Policies promoting new technologies and emerging industries stimulated rapid growth in shipbuilding, smart consumer devices, and lithium battery production. Incentives for new energy vehicles and home appliance upgrades further boosted output. In November, export delivery value increased 7.4% year-on-year, representing the highest monthly growth since August 2022 and providing a strong boost to industrial chains.
Investment Growth Eases Slightly Despite Policy Support
Investment increased 3.3% year-on-year from January to November, with monthly growth decelerating to 2.4% in November. Infrastructure investment slightly decelerated to 4.2%, whereas manufacturing investment maintained a strong pace of 9.3%. Real estate investment declined further to -11.5%, but property sales recorded positive monthly growth for the first time since April 2023, increasing developers' funding sources. Transportation and storage investment declined sharply, whereas gains in power and water infrastructure provided significant support.
Multiple Measures to Bolster and Sustain Consumption Growth
Consumption continued to recover steadily as policies such as trade-ins for new products further stimulated consumer demand, resulting in strong sales across most categories. From January to November, retail sales increased 3.5% year-on-year, maintaining the same pace as the previous period. In November, retail sales grew 3.0%, seeing a slight moderation attributed to early "Double 11" promotions and a strong comparison base from last year. Policies promoting product upgrades led to significant growth in auto and furniture sales, which increased by 6.6% and 10.5%, respectively. Construction and renovation materials saw a resurgence, recording a 2.9% increase. Service-related retail sales also sustained a robust upward trend under the influence of various consumption-boosting measures.
Domestic Prices Gradually Return to Stable Levels
In November, coordinated policies boosted industrial recovery, resulting in a shift in the Producer Price Index from decline to slight monthly growth, reducing its year-on-year shrinkage by 0.4 percentage points. Prices in key sectors, including petroleum extraction, chemicals, and electricity, experienced minor reductions. On the Consumer Price Index (CPI) front, food prices dropped 2.7% month-on-month, markedly above the seasonal average decline over the past decade, mainly attributable to abnormal weather that enhanced agricultural production and logistics. This resulted in a month-on-month decrease of 0.6% in the overall CPI. Non-food prices also fell by 0.1%, indicating weaker demand for travel during the off-season. The decrease in food prices contributed to a moderation in the year-on-year CPI increase, which eased to 1.0%.
Navigating Economic Downturn - Fiscal Expansion to Drive Money Creation and Policy Implementation
Date: Nov 20, 2024
In October, the economy experienced a broad-based recovery from the previous month's lows. This improvement was supported by the latest round of macro policies and a favorable shift in export dynamics. Export growth surged due to timing discrepancies, which, in turn, energized the export-linked industries. The push for equipment upgrades and consumer goods trade-ins buoyed manufacturing demand and investment. Infrastructure investment gained momentum as existing policies took effect and new ones accelerated. Real estate saw a lift in transaction volume due to supportive…
Reversing Economic Downward Spiral, Swift and Targeted Action Needed
Date: October 20, 2024
During the first three quarters of 2024, a slowdown in overseas demand and increasing uncertainties contributed to a deceleration in year-on-year export growth compared to the first half of the year. Nonetheless, exports continued to drive the development of related industries within the industrial supply chain. The demand and investment in manufacturing were bolstered by policies encouraging large-scale equipment renewals and consumer trade-ins for new products. Additionally, the pace of implementation of infrastructure project reserves increased. Despite existing…
Heightened Vigilance Required Against Economic Downward Spiral
Date: August 20, 2024
Export growth recovered in August, and policy support bolstered manufacturing investment. However, growth in infrastructure investment and physical work volume were supressed. As real estate policies have been implemented, more measures are expected to boost market confidence. Consumer spending growth has slowed, with industrial and consumer goods prices remaining low. Public budget revenues and monthly consumption in top-tier cities fell, the decline in M1 money supply widened, and urban surveyed unemployment rates rose beyond seasonal patterns—all pointing to…
The Momentum for Economic Recovery Still Needs to be Strengthened, and Incentives for All Entities Need Improving
Date: August 20, 2024
In July, export growth slowed compared to the previous month amid global manufacturing volatility and increasing international uncertainties. Local infrastructure development remained sluggish, and the real estate sector continued to struggle. Although consumer spending saw a modest increase, its sustainability remains uncertain. Industrial product prices continued to fall and consumer prices stayed low. These challenges were further underscored by negative growth in public budget revenue, lower monthly consumption in first-tier cities, and a decrease in M1 money…
Economy Continued to Expand Amidst Growing Pressure, Further Policy Needed to Boost Expectations
Date: Jul 20, 2024
In the first half of 2024, export growth accelerated due to global manufacturing recovery, and consumer goods sales remained steady thanks to supportive policies and other factors. However, the sustained decline in industrial product prices and the persistently low consumer prices suggest that demand remains relatively weak. The real estate market remains sluggish, overall societal expectations are still low, and businesses are under significant operational pressure. To turn the tide, it's crucial for policies to be significantly ramped up as soon as possible to improve…
Policies and External Demand Boost Economic Improvement
Date: Apr 20, 2024
In the first quarter of 2024, the economy improved overall due to the combined effect of recovering external demand, the sustained impact of earlier policies, the timing of the Spring Festival, and changes in base figures. Major macroeconomic indicators remained generally stable, but data for March showed signs of marginal weakening compared to January and February. This weakening is partly due to the base effect but also requires close attention, indicating the need for sustained policy efforts.
Policies, among other factors, have contributed to the overall economic…
Economic Performances Fell Back, Policy Support Still Needed
Date: November 20, 2023
In October, China's economy may not appear to gain a strong recovery. However, a rational look at the situation shows there is some potential amid the current difficulties. Weakness in overseas manufacturing led to a decline in exports, impacting relevant industrial chains. Infrastructure and real estate investments remained weak, while manufacturing investment stayed stable owing to policy support and shifting demands. Supported by holiday promotions and a resurgence in service consumption, overall consumption remained resilient, although certain consumer goods…
Treat Recovery Data with Caution
Date: Feb 27, 2023
Because of Chinese New Year, the statistics bureau didn’t announce price, financial and PMI data until February. China switched from zero-COVID lockdown to almost no restrictions in December 2022, and by January 2023, normal life had nearly returned. The economy is generally improving, but caution about its sustainability is required.
Manufacturing PMI, the non-manufacturing business index and the composite PMI production index were 50.1%, 54.4%, and 52.9% in January 2023, up 3.1, 12.8, and 10.3 pps from December. All rose to the improvement zone, showing that the…
Back on Track in 2023
Date: Jan 29, 2023
GDP grew 3% in 2022. Specifically, China’s economy rose by 2.9% y/y in Q4 2022, down from the 3.9% growth reported in Q3. Many negative factors affected the economy in 2022, including global macroeconomic tightening, the Ukraine crisis, real estate restructuring, the pandemic management policies and so forth. As some of the above factors abated, particularly abolishment of the zero-COVID policy, we expect that, after a turbulent 2022, the economy will be back on track in 2023.
Industrial output grew 3.6% in 2022, down 6 pps from 2021. Investment rose 5.1%, up 0.2 pps,…
Recovery Is Constrained By Covid, Again
Date: Nov 24, 2022
Growth is weakly recovering, with pressure ahead largely from the Covid prevention and its related lockdowns. Although there was some rumor regarding abandoning the zero-Covid policy, there were also signs that China will commit to this policy in the short term, citing reasons from state media that China’s per capita medical resource is low. We forecast that although there might be some relaxing adjustment, for example that foreign entry has reduced to five-day quarantine from seven days, the zero-Covid policy will not be abandoned soon.
In January-October, industrial…
Recovery Slows Amid Weakening Global Economy
Growth strengthened, but only slightly. In August, industrial output rose 4.2% y/y, up 0.4 pps, lifting overall January-August growth to 3.6%, up 0.1 pps. Investment rose 5.8% y/y in January-August, up 0.1 pps. The August growth rate was 6.4% y/y, up 2.8 pps. Real estate investment growth rate fell further, to -13.8% y/y, down 1.7 pps from August 2021.
In August 2022, consumption rose 5.5% y/y, up 2.7 pps. This is partly due to the low base number of last year, when consumption rose 2.5%, and was down 6 pps from August 2021.
Exports rose 11.8% y/y, down 12.1 pps from July 2022. This seems…
Real Estate Cooling Drags Economic Recovery
Industrial output grew 3.5% y/y in January-July, up 0.1 pps from H1. In January-July, investment rose 5.7% y/y, down 0.4 pps from H1. In particular, the investment growth rate in July was down 2.4 pps from June. High infrastructure investment has been flattened by reduced real estate investment.
Retail sales of social consumption goods fell -0.2% y/y in January-July, up 0.5 pps from January-June. Exports were still strong. In July, exports rose 23.9% y/y, up 1.9 pps from June. Due to the stop of global monetary policy easing, the continuing Ukraine crisis, and the ongoing pandemic, other…
Recovering from the Lockdowns
GDP only grew 2.5% y/y in H1. As the pandemic shock has been gradually under control and the start of various economic stabilization policies, the recovery growth in June has lifted the Q2 growth to achieve positive growth at 0.4% y/y, contributing to the path “back to normal”.
In H1, industrial output rose 3.4% y/y, down 3.1 pps from Q1. In H1, investment growth rate was 6.1% y/y, down 3.2 pps from Q1, but still 1.2 pps faster than 2021. The continuing real estate cooling does not see any time ending.
Pandemic lockdowns suppressed consumption. Retail sales of social consumption goods fell…
Signs of monetary and fiscal expansion at last
Because of the long Chinese New Year holiday, the statistics bureau only announced price, financial and PMI data in February. Producer prices grew more slowly. PPI rose 9.1% y/y, down another 1.2 pps from December. The ex-factory price index of industrial goods rose 8.85% y/y, while CPI growth also slowed. CPI rose 0.9% y/y in January, down 0.6 pps from December. In particular, food prices fell -3.8% y/y, down 2.6 pps from December, dragging CPI down 0.72 pps. That is the leading factor lowering CPI. The falling price levels offer ample room for further money expansion.
At the end of…
Lockdown Halts Powerful Economic Recovery
The COVID-19 lockdowns in Shanghai and some other cities since late March have halted the strong economic recovery. In Q1, GDP was up 4.8% y/y, up 0.8 pps from Q4 2021, but 0.2 pps lower than in Q1 2020. Industrial output rose 6.5% in Q1, up
2.6 ppts from Q4, but down 1 pps from January-February. Investment rose 9.3% y/y in Q1, up 4.4 pps from 2021, but 2.9 pps lower than in January-February.
In March, overall PMI, manufacturing PMI, and non-manufacturing business activity PMI were 48.8%, 49.5% and 48.4% respectively, all falling steeply from the previous month, demonstrating that the…
Signs of monetary and fiscal expansion at last
Executive summary
Because of the long Chinese New Year holiday, the statistics bureau only announced price, financial and PMI data in February. Producer prices grew more slowly. PPI rose 9.1% y/y, down another 1.2 pps from December. The ex-factory price index of industrial goods rose 8.85% y/y, while CPI growth also slowed. CPI rose 0.9% y/y in January, down 0.6 pps from December. In particular, food prices fell -3.8% y/y, down 2.6 pps from December, dragging CPI down 0.72 pps. That is the leading factor lowering CPI. The falling price levels offer ample room for further money expansion.
At…
Yuan may appreciate further in 2022, but not hit 6 to the dollar
Growth continues to be weak. In November, industrial output grew 3.8% y/y, down 1.1 pps from Q3, much lower than the growth rates of recent years. Investment is also low, and was up 7.9% y/y, and down 1.2 pps from January-June. Its adjusted growth rate is instead negative. The real estate market is still cold: sales were down -14.2% y/y in November.
Consumption rose 3.9% y/y in November, down 1 pps from October, and its adjusted growth rate was 0.5% y/y, hitting its lowest level this year. But trade is still strong. Imports were up 26% y/y, and up 9.8 pps from Q3. Exports were up16.6% y/y.
…Growth weakens, though more structural reforms are underway
Growth has weakened, especially in services. In August, industrial output grew 5.3% y/y, and was up 11.2% from August 2019, with an annualized growth rate of 5.4%, down 0.2 ppts from July, and down 1.2 ppts from Q2. The service production index has slowed since Q2, and grew only 4.8% y/y in August, after being further hit by the COVID outbreaks, down 2.9 ppts from Q4 2020, and down 2.1 ppts from 2019.
Investment was up 8.9% y/y January-August, and increased 8% from August 2019, with an annualized growth rate of 4%, down 0.5 ppt from H1. Real estate is cooling dramatically, to the 2008…
Growth may be slower
The Chinese economy has been stably rising in Q2. GDP was up 7.9% y/y, and up 11.4% from Q2 2019, with an annualized growth rate of 5.5%, up 0.5 pps from Q1. Industrial output was up 8.9% y/y, and up 13.7% from Q2 2019, with an annualized growth rate of 6.6% y/y, slightly lower than in Q1 but higher than the pre-pandemic 2019 level; specifically, growth in June was 6.5%.
Investment was up 12.6% y/y, and increased 9.1% from Q2 2019, with an annualized growth rate of 4.4% y/y, up 1.8 pps from Q1, and down 1 pps from 2019. In Q2, retail sales of social consumption goods were up 9.5% from Q2…
Stronger yuan against a weak dollar
Growth was stable in May. Industrial output rose 8.8% y/y, and increased 13.6% from May 2019, with an annualized growth rate of 6.6%. Investment rose 15.4% y/y, and increased 8.5% from May 2019, with an annualized growth rate of 4.2% y/y -- still in a low growth zone.
Consumption has recovered further. In May, retail sales of social consumption goods rose 9.3% y/y from May 2019, with an annualized growth rate of 4.5%, up 0.2 pps from April. Trade has been strong since the beginning of this year, especially for imports, which are growing robustly. In May, imports rose 39.5% y/y. Exports rose…

