China Macro Outlook
Economic Recovery Gathers Pace Amid Policy Support and Structural Shifts
Date: March 20, 2025
Following the Spring Festival, economy regained momentum in February as businesses resumed operations, accelerating production and commercial activity. Key indicators such as the Manufacturing Purchasing Managers’ Index (PMI), Non-Manufacturing Business Activity Index, and Composite PMI Output Index all rebounded month-on-month, remaining in expansionary territory. While these figures signal a tentative recovery from earlier lows, sustaining growth will demand stronger policy reinforcement and expedited implementation.
Economic Recovery Shows Marginal Improvement from…
Growth Momentum Moderates, Highlighting Need for Accelerated Policy Support
Date: Feb 20, 2025
In January, due to the Spring Festival holiday and seasonal factors, industrial production entered an off-season, with the Producer Price Index (PPI) declining month-on-month. However, service and food prices rose significantly affected by the timing of the holiday, along with a rebound in gasoline prices, collectively driving an expansion in the Consumer Price Index (CPI) year-on-year growth. Overall, despite signs of moderation, economic activity remains on a positive trajectory, underscoring the need to expedite the implementation of supportive measures
Economic Growth…
Stable Economic Performance in 2024, with Ongoing Policy Support Needed
Date: Jan 20, 2025
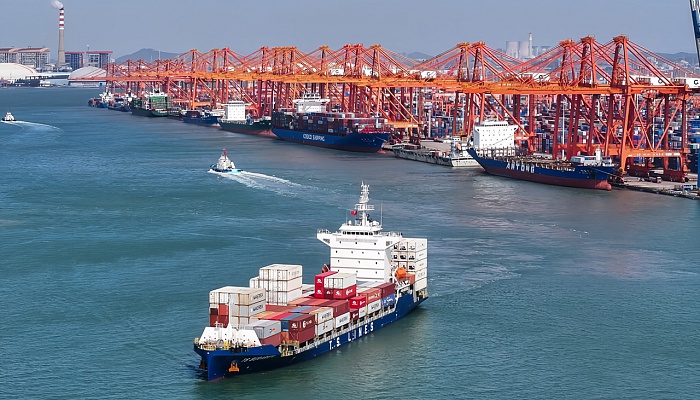
Despite external pressures and domestic challenges, China's economy exhibited stability and steady progress in 2024. Targeted incremental policies boosted confidence and facilitated a strong recovery. Export growth decelerated in the first three quarters owing to diminished global demand, although industrial supply chains remained resilient. In Q4, an increase in "front-loading exports" stimulated manufacturing growth, whereas large-scale equipment upgrades and consumer goods trade-in programs maintained ongoing demand and investment in manufacturing. Existing policies,…
Economy Sustains Positive Momentum With Targeted Policy Support
Date: December 20, 2024
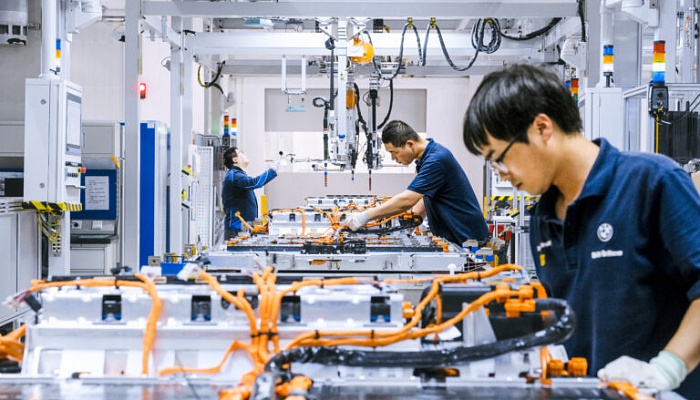
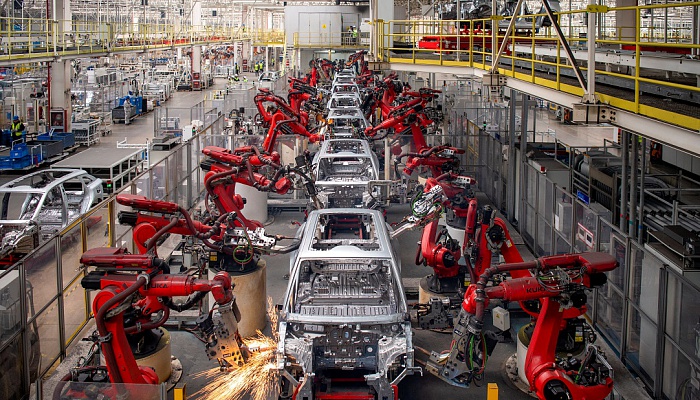
In November, the combined effects of macroeconomic policies became more evident. The acceleration of export growth boosted industrial chains, while policies promoting large-scale equipment upgrades and consumer goods trade-ins bolstered manufacturing demand and investment. Infrastructure investment, though slightly decelerating, demonstrated resilience due to the effective execution of existing policies and the accelerated implementation of new measures. Concurrently, strengthened real estate support policies increased transaction volumes; nonetheless, achieving…
Navigating Economic Downturn - Fiscal Expansion to Drive Money Creation and Policy Implementation
Date: Nov 20, 2024
In October, the economy experienced a broad-based recovery from the previous month's lows. This improvement was supported by the latest round of macro policies and a favorable shift in export dynamics. Export growth surged due to timing discrepancies, which, in turn, energized the export-linked industries. The push for equipment upgrades and consumer goods trade-ins buoyed manufacturing demand and investment. Infrastructure investment gained momentum as existing policies took effect and new ones accelerated. Real estate saw a lift in transaction volume due to supportive…
Reversing Economic Downward Spiral, Swift and Targeted Action Needed
Date: October 20, 2024
During the first three quarters of 2024, a slowdown in overseas demand and increasing uncertainties contributed to a deceleration in year-on-year export growth compared to the first half of the year. Nonetheless, exports continued to drive the development of related industries within the industrial supply chain. The demand and investment in manufacturing were bolstered by policies encouraging large-scale equipment renewals and consumer trade-ins for new products. Additionally, the pace of implementation of infrastructure project reserves increased. Despite existing…
Heightened Vigilance Required Against Economic Downward Spiral
Date: August 20, 2024
Export growth recovered in August, and policy support bolstered manufacturing investment. However, growth in infrastructure investment and physical work volume were supressed. As real estate policies have been implemented, more measures are expected to boost market confidence. Consumer spending growth has slowed, with industrial and consumer goods prices remaining low. Public budget revenues and monthly consumption in top-tier cities fell, the decline in M1 money supply widened, and urban surveyed unemployment rates rose beyond seasonal patterns—all pointing to…
The Momentum for Economic Recovery Still Needs to be Strengthened, and Incentives for All Entities Need Improving
Date: August 20, 2024
In July, export growth slowed compared to the previous month amid global manufacturing volatility and increasing international uncertainties. Local infrastructure development remained sluggish, and the real estate sector continued to struggle. Although consumer spending saw a modest increase, its sustainability remains uncertain. Industrial product prices continued to fall and consumer prices stayed low. These challenges were further underscored by negative growth in public budget revenue, lower monthly consumption in first-tier cities, and a decrease in M1 money…
Economy Continued to Expand Amidst Growing Pressure, Further Policy Needed to Boost Expectations
Date: Jul 20, 2024
In the first half of 2024, export growth accelerated due to global manufacturing recovery, and consumer goods sales remained steady thanks to supportive policies and other factors. However, the sustained decline in industrial product prices and the persistently low consumer prices suggest that demand remains relatively weak. The real estate market remains sluggish, overall societal expectations are still low, and businesses are under significant operational pressure. To turn the tide, it's crucial for policies to be significantly ramped up as soon as possible to improve…
Policies and External Demand Boost Economic Improvement
Date: Apr 20, 2024
In the first quarter of 2024, the economy improved overall due to the combined effect of recovering external demand, the sustained impact of earlier policies, the timing of the Spring Festival, and changes in base figures. Major macroeconomic indicators remained generally stable, but data for March showed signs of marginal weakening compared to January and February. This weakening is partly due to the base effect but also requires close attention, indicating the need for sustained policy efforts.
Policies, among other factors, have contributed to the overall economic…
About CDI...
Newsletter
Receive regular updates on CDI events, activities, and projects. Subscribe below.
News
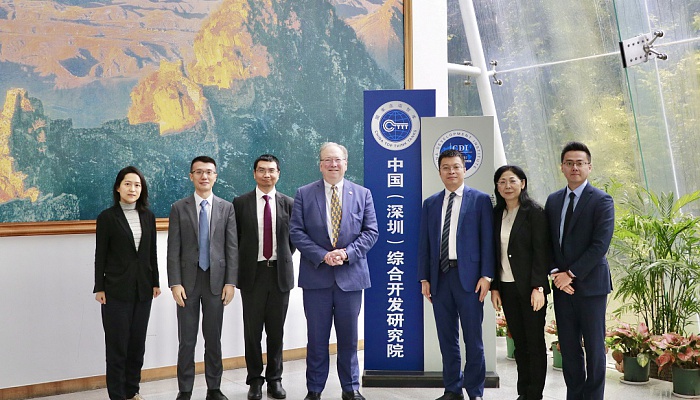
Former Lord Mayor of the City of London, Prof. Michael Mainelli, Visits CDI
Date: March 31, 2025
On March 31, 2025, Prof. Michael Mainelli—British economist, former Lord Mayor of the City of London, and Chairman of Z/Yen Group—visited CDI. Prof. Mainelli shared insights on Z/Yen’s recent projects, including efforts to reduce trade barriers, initiatives to support the…
The Executive Office of H.H. Sheikh Mohammed Bin Rashid Al Maktoum (TEO) Delegation Visited CDI
Date: Nov 29, 2024
On November 29, 2024, a delegation from The Executive Office of H.H. Sheikh Mohammed Bin Rashid Al Maktoum (TEO) visited CDI. The discussions focused on cultural exchange, tourism collaboration, and policy alignment, while highlighting significant opportunities for cooperation…
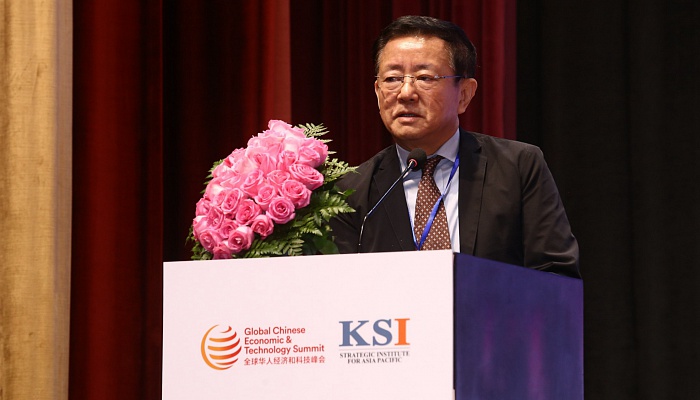
President Fan Gang Spoke at the 2024 Global Chinese Economic and Technology Summit
Date: Nov 26 2024
The 2024 Global Chinese Economic and Technology (GCET) Summit was held on November 26, 2024, in Phnom Penh, Cambodia. The event was organized by the KSI Strategic Institute for Asia Pacific and supported by the China Development Institute (CDI).
The world is facing growing…
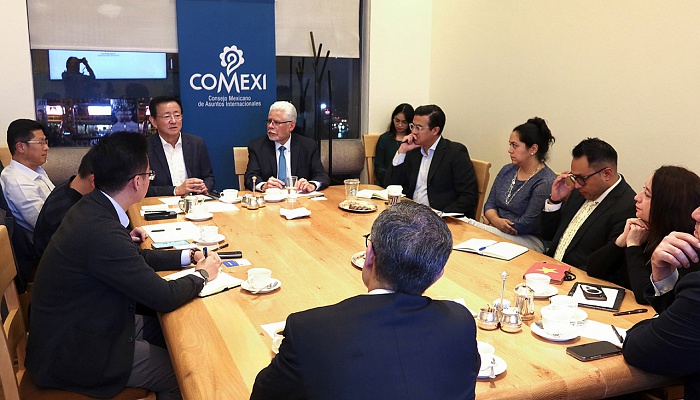
CDI and Mexican Council on Foreign Relations Jointly Held Seminar
Date: September 12, 2024
During a discussion hosted by the Mexican Council on Foreign Relations and CDI on September 12, 2024, Chinese and Mexican officials, scholars, and entrepreneurs shared insights on the trajectory of Sino-Mexican relations against the backdrop of U.S.-Mexican relations, as…
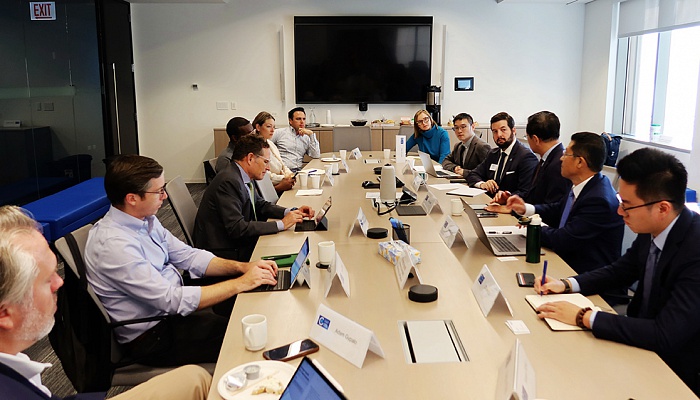
President Fan Gang Visited Chicago Council on Global Affairs and University of Chicago
Date: September 10, 2024
CDI delegation led by President Prof. Fan Gang visited Chicago think tanks on September 10, 2024. During the roundtable discussion, Professor Fan addressed China’s economic development and the prospects for U.S.-based international companies operating in China. Academics…
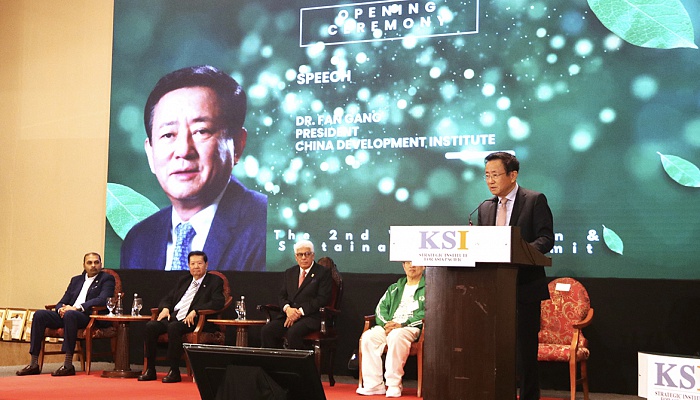
President Fan Gang Spoke at World Green & Sustainability Summit, Urging Global Collaboration on Green Public Goods
Date: June 25, 2024
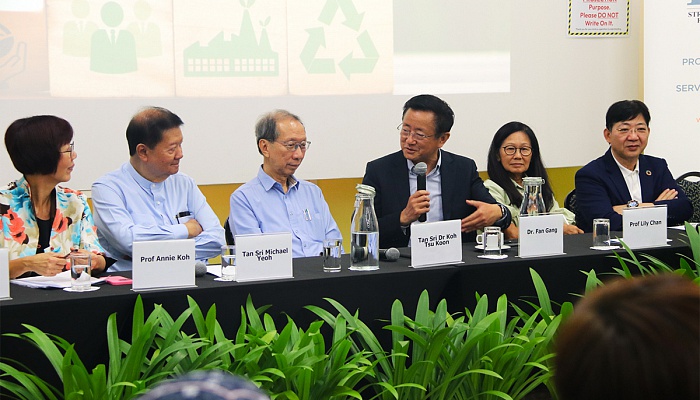
The 2024 World Green & Sustainability Summit held on June 25, 2024 in Penang Malaysia, organized by World Digital Chamber, World Green Organization, KSI Strategic Institute for Asia Pacific and supported by China Development Institute, convened government leaders, think…
Academia and Think Tanks Advocated for Green and Sustainable Development
Date: June 24, 2024
On June 24, 2024, in the roundtable on collaboration between universities and think tanks on climate action, green and sustainable development, Prof Fan Gang, President of China Development Institute, underscored that it is critical for the international community to expand…
Singapore Institute of International Affairs Delegation Visited CDI
Date: May 23, 2024
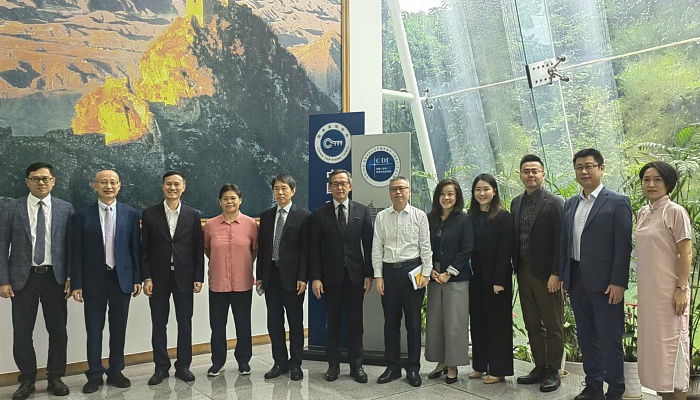
On May 23, 2024, Prof. Simon Tay led Singapore Institute of International Affairs (SIIA) delegation to CDI. Exchange surrounded topics such as new quality production forces, the Guangdong-Hong Kong-Macao Greater Bay Area (GBA), and economic cooperation prospect between ASEAN and…
New Zealand Ambassador to China H.E. Grahame Morton Visited CDI
Date: Mar 26, 2024
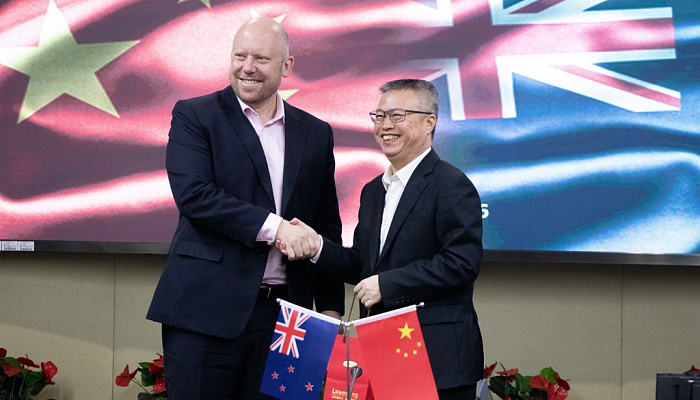
On March 26, 2024, New Zealand delegation led by H.E. Ambassador Grahame Morton visited CDI. The visit sparked in-depth discussions on various topics, including economic policies concerning the Guangdong-Hong Kong-Macao Greater Bay Area (GBA), development progress of the GBA,…
Prof. Herrmann-Pillath and GBA Experts Shared Insights on NbS and Designing BiodiverCity
Date: Mar 19, 2024
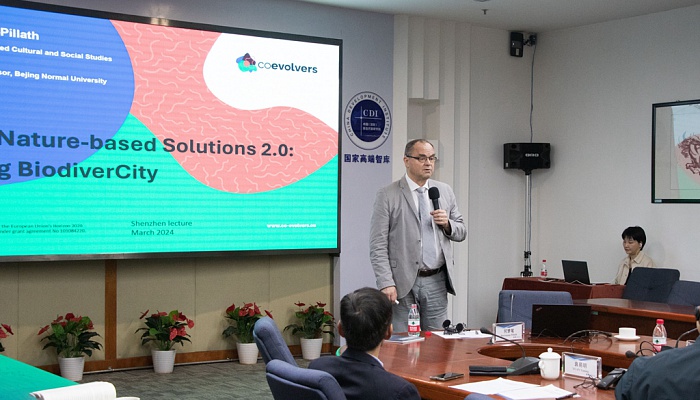
Nature-based solutions (NbS) refers to actions that effectively address social, economic and environmental challenges through the protection, sustainable management and restoration of natural and modified ecosystems. Since the official introduction of NbS by the World Bank in…
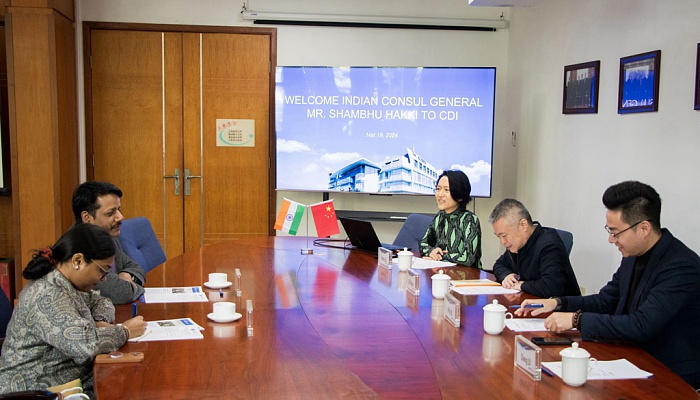
Consul General of India to Guangzhou Mr. Shambhu Hakki Visited CDI
Date: Mar 19, 2024
On Mar 19, 2024, Consul General of India to Guangzhou Mr. Shambhu Hakki visited CDI. Discussion focused on China’s macro-economic outlook, Guangdong’s economic development, and Sino-India trade relations. Given the growing trade activities between China and India, research…
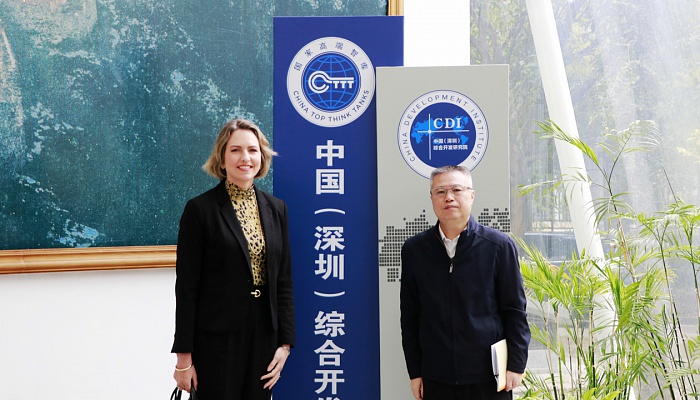
Rachel Crump, Consul-General of New Zealand in Guangzhou Visited CDI
Date: Feb 27, 2024
Consul-General of New Zealand in Guangzhou Ms. Rachel Crump visited CDI on February 27, 2024. Discussion surrounded topics such as New Zealand and Guangdong’s trade relation, Shenzhen’s economic development, and the trends of electric vehicles in China. Dr. Guo Wanda, Executive…
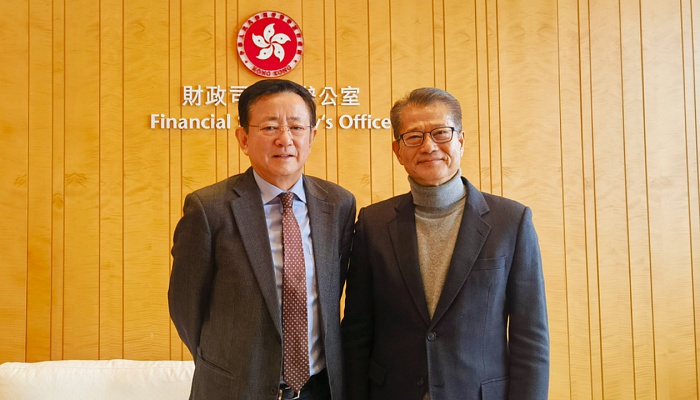
Professor Fan Gang Met with Financial Secretary Paul Chan Mo-po of Hong Kong
Date: Jan 31, 2024
From 21st to 26th Jan 2024, Prof. Fan Gang, President of China Development Institute, was invited by the Government of Hong Kong Special Administrative Region to visit Hong Kong and conduct in-depth exchange with government officials, including Financial Secretary Mr. Paul Chan…
Research Reports
This is CDI
-
CHINA TOP THINK TANKS PILOT PROJECT
CDI has been designated as one of the 25 China Top Think Tanks
in a pilot project of the Chinese government since 2015.
Read More
- 1
Insights
A Fresh Start for Platform Economy in China
Date: September 15, 2024
Author: Dr. CAO Zhongxiong, Assistant President of CDI, and the Director of the Digital Strategy and Economic Research Center
China's platform economy has evolved through distinct stages, transitioning from unchecked growth to a phase of well-regulated governance and innovative development. Over time, this process has cultivated a group of leading platform enterprises. The last three years have been pivotal, signifying a period of significant transformation. Initially driven by the rapid rise of the "Internet Plus" initiative, platform enterprises expanded into traditional industries, often being equated with e-commerce companies by the public. However, as digital…
Integrated Healthcare and Elderly Care: A Pressing Challenge Amid Population Aging
Date: September 13, 2024
Author: Dr. LIU Jie, Senior Research Fellow at CDI
In 2021, China transitioned to a moderately aging society, with the aging process set to accelerate, posing increasing challenges to healthcare and elderly care. The rapid aging phenomenon is marked by three key features:
Trend: China’s aging population is poised to join the “fast lane.” Structure: The proportion of the very elderly population is steadily increasing. Features: Issues related to chronic diseases and disabled older adults are becoming more pronounced.The China Population Aging Development Trend Forecast Report indicates that China will reach critical milestones in the acceleration of aging between…
The Long Journey of Chinese Culture to Reach the World
Date: August 27, 2024
Author: Mr. MING Liang, Research Fellow, Institute of Urbanization, CDI
In 2024, the Chinese AAA game Black Myth: Wukong debuted spectacularly, swiftly becoming a trending topic and a "top influencer." Inspired by the Chinese literary classic Journey to the West, this game has indeed created a “black myth,” achieving dual success in both critical acclaim and sales. The wide-ranging discussions it has sparked primarily revolve around the following three aspects:
1.Black Myth: Wukong Sets a Benchmark for High-Quality AAA Games in China
Domestic developers rarely ventured into AAA game territory owing to high costs, lengthy development cycles, and competitive threats.…
Unchartered Water: AI and Its Implications for Copyright Law
Author: Dr. LI Enhan, Deputy Director of Token Digital Economy Research Center, CDI
Editor’s note: In the wave of global digitalization and intelligence, AI's role in artistic creation is challenging the foundations of copyright law. Questions about the originality of AI works, their copyright ownership, and the criteria for infringement are now at the forefront for legal experts. Against this backdrop, China and the United States, as major global players, are navigating the uncharted waters of AI and copyright with their distinct legal practices likely to shape international norms.
The growth of artificial intelligence (AI) requires a redefinition of traditional copyright concepts,…
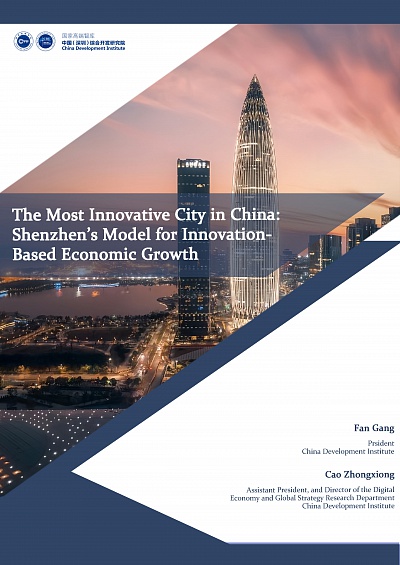
Shenzhen Exemplifies Rapid Economic Rise on The Back of Tech Innovation
Author: Fan Gang, President of CDI and Cao Zhongxiong, Assistant President of CDI.
As a special economic zone and a city blossoming on science and technology, Shenzhen, in South China’s Guangdong Province, is not only an economic front-runner, but also a great “mirror” illustrating China’s quick pace of technology innovation and economic development.
The development of Shenzhen has been subject to questioning on many occasions in the past decades, but the city has always responded by ironing out the doubts through its rapid development in both headwinds and tailwinds.
Shenzhen represents new quality productive forces, new systems, as well as birth of new and creative policies. It is the…
Giant Ship of China’s Economy Cruises Steadily, Defying ‘Peak’ Hype
Author: Cao Zhongxiong, Assistant President of CDI.
Despite the challenges posed by the lackluster global economy and an increasingly complex, severe, and uncertain external environment, China’s economy managed to achieve 5.2 percent growth in 2023. This growth contributed over 30 percent to global economic growth, solidifying China’s role as a crucial engine for global economic expansion. China’s economy, which is pushing over risks and challenges, has maintained steady growth in terms of quantity and scale.
In the face of multiple challenges, China successfully exceeded its annual growth target of around 5 percent set by the Government Work Report for 2023, further enhancing its status…
GFCI
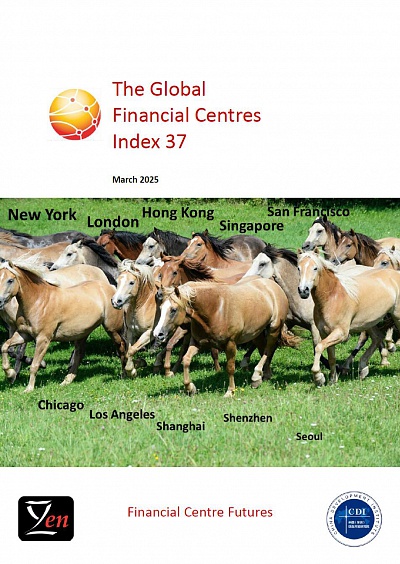
The Global Financial Centres Index 37 (GFCI 37)
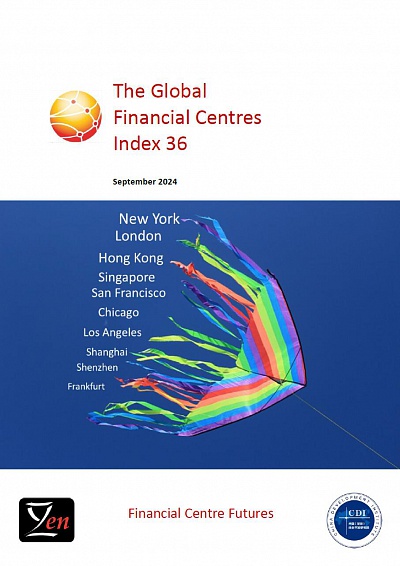
The Global Financial Centres Index 36 (GFCI 36)
The Global Financial Centres Index 35 (GFCI 35)
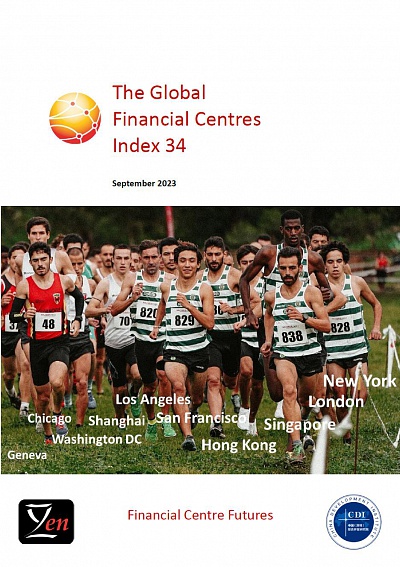
The Global Financial Centres Index 34 (GFCI 34)
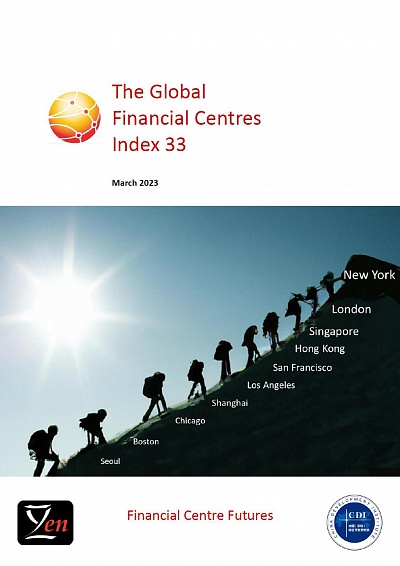
The Global Financial Centres Index 33 (GFCI 33)
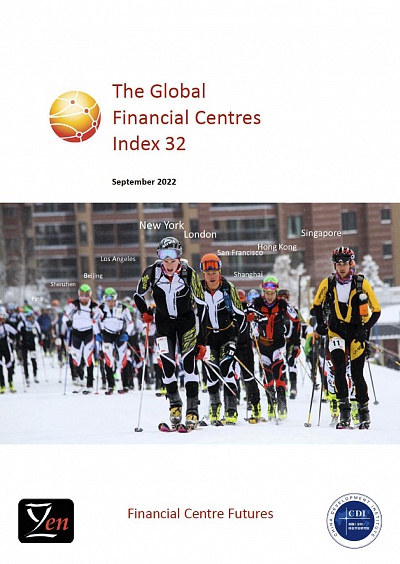
The Global Financial Centres Index 32 (GFCI 32)
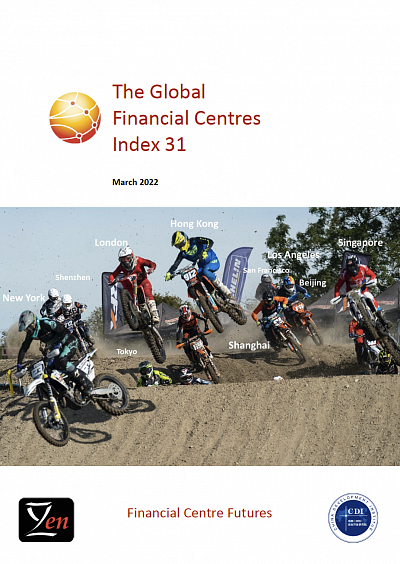
The Global Financial Centres Index 31 (GFCI 31)
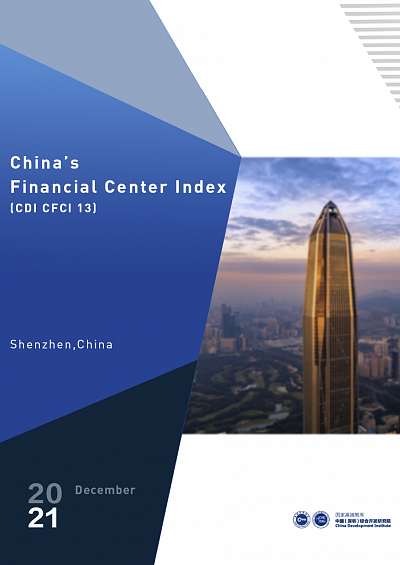
China’s Financial Center Index 13 (CFCI 13)
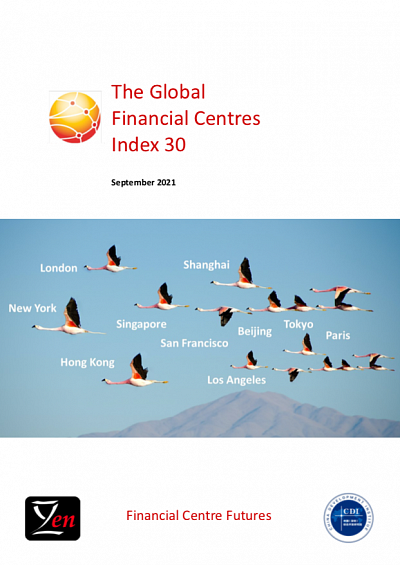
The Global Financial Centres Index 30 (GFCI 30)
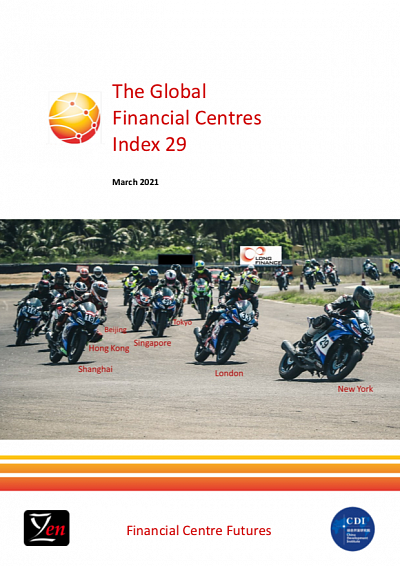
The Global Financial Centres Index 29 (GFCI 29)
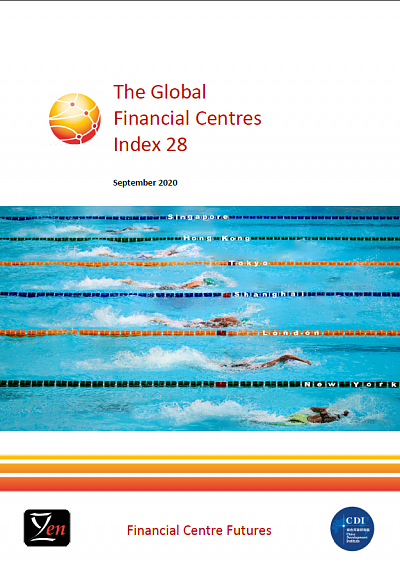
The Global Financial Centres Index 28 (GFCI 28)
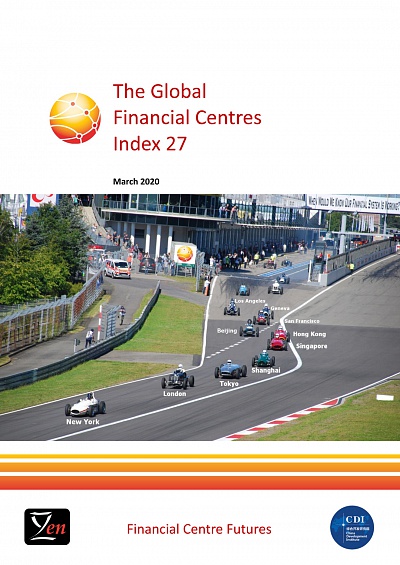
The Global Financial Centres Index 27 (GFCI 27)
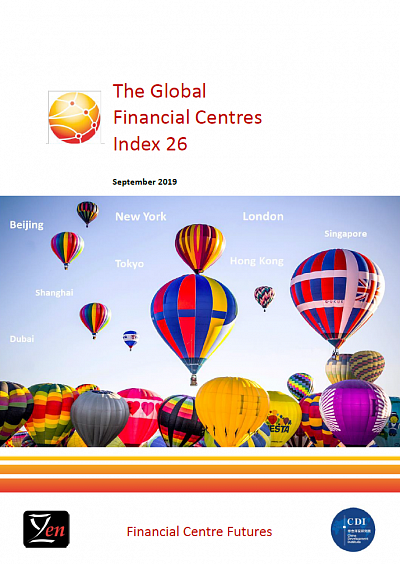
The Global Financial Centres Index 26 (GFCI 26)
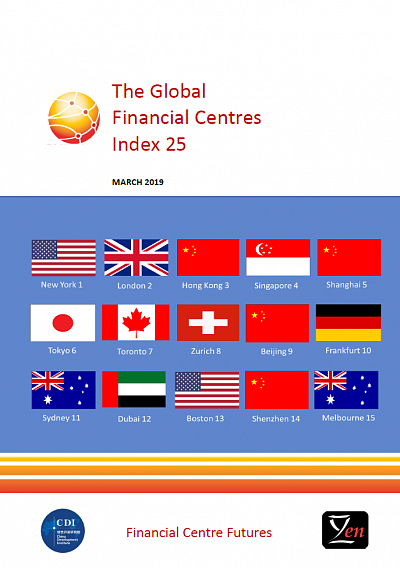
The Global Financial Centres Index 25 (GFCI 25)
China Financial Centers Index (CFCI 10)
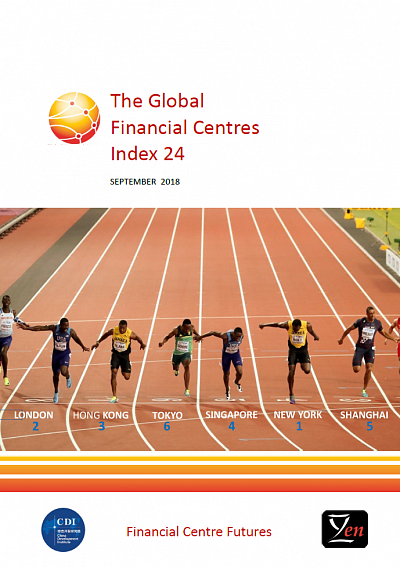
The Global Financial Centres Index 24 (GFCI 24)
The Global Financial Centres Index 23 (GFCI 23)
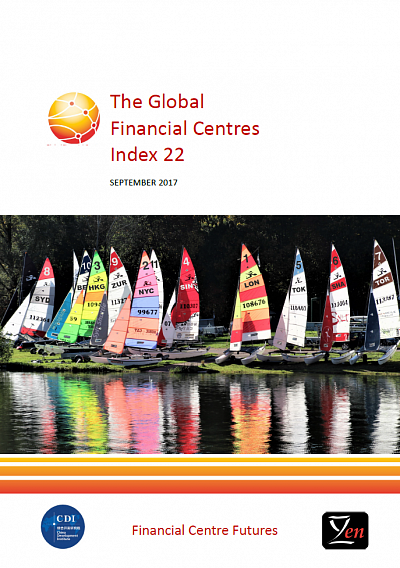
The Global Financial Centres Index 22 (GFCI 22)
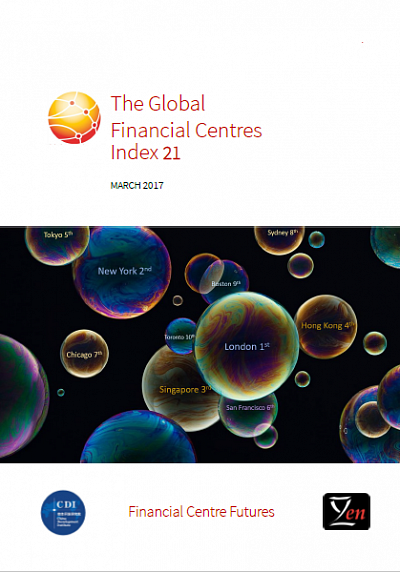
The Global Financial Centres Index 21 (GFCI 21)
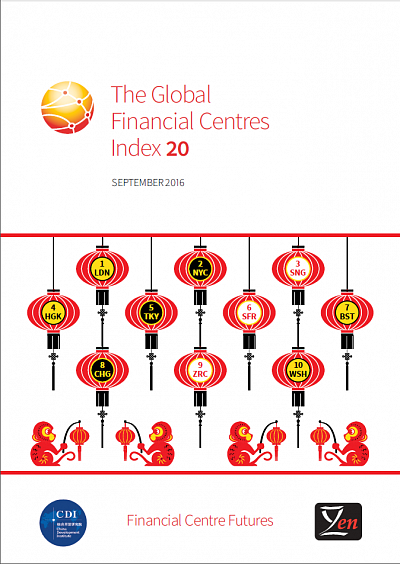
The Global Financial Centres Index 20 (GFCI 20)
Events
Launch Of Global Financial Centres Index 36
Information
In March 2007, Z/Yen and the City Of London released the first edition of the Global Financial Centres Index(GFCI), which provides evaluations of competitiveness and rankings for the…
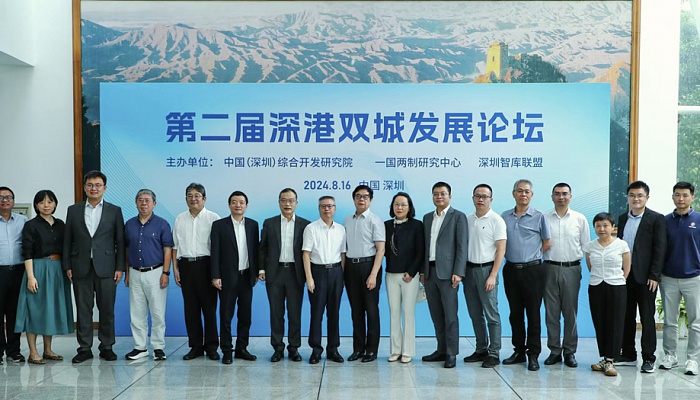
2024 Shenzhen Hong Kong Cooperation Forum
Information
Shenzhen and Hong Kong are the “Twin Stars” of the Guangdong-Hong Kong-Macao Greater Bay Area. Hong Kong is a highly advanced international financial center, while Shenzhen has…
New Zealand – China Green Ports Dialogue (Invitation Only)
Information
Date and time: Thursday October 19, 2023 09:00-12:15 (Beijing Time)
Host: China Development Institute and New Zealand China Council
New Zealand and China are both committed to pursuing ambitious national carbon emission reduction goals. Transport emissions including from international…
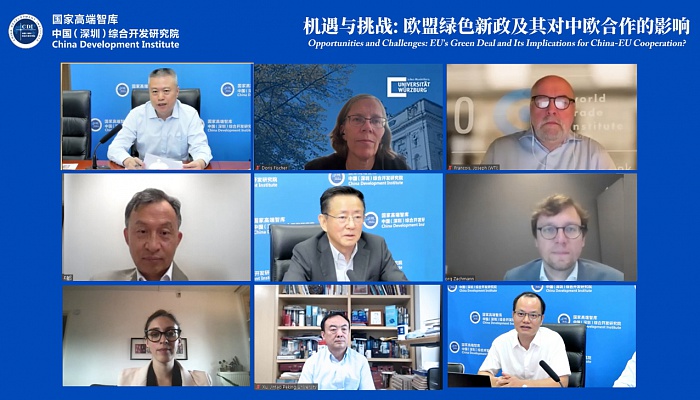
China-Europe Webinar - EU's Green Deal and Its Implications for China-EU Cooperation
Information
Date and time: Wednesday July 12, 2023 15:00-17:10 (Beijing Time)
Host: China Development Institute
The EU’s rules for the new carbon border adjustment mechanism (CBAM) became effective on 17 May. CBAM aims to prevent carbon leakage and restore a level playing field in high-emitting…
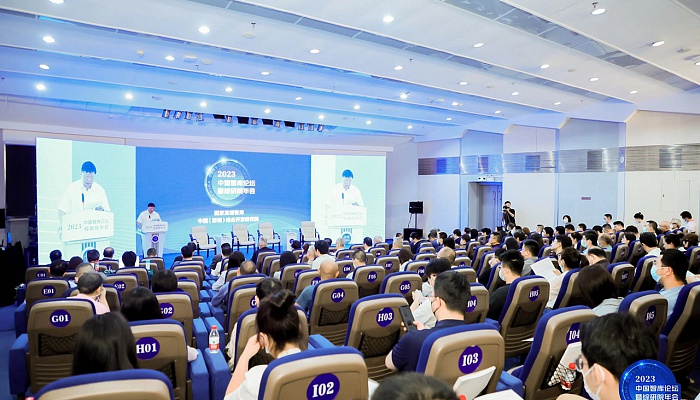
China Think Tank Forum & CDI 2023 Annual Conference
Information
The year 2023 marks the 45th anniversary of China’s reform and opening-up. Currently, China is in the midst of increasingly complicated international political and economic environment and needs to tackle domestic issues such as the lack of scientific and technological innovation…
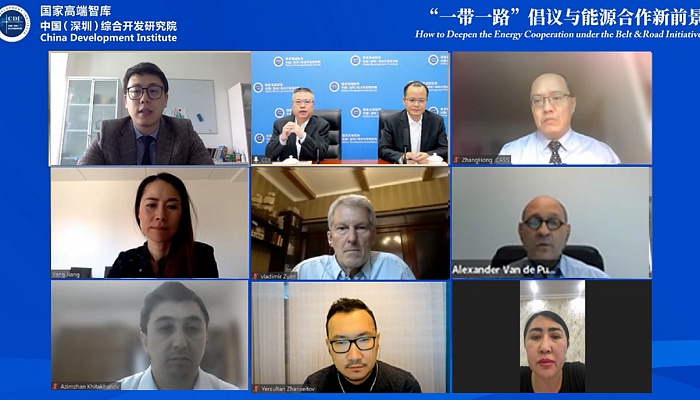
China-Central Asia Cooperation Webinar - How to Deepen the Energy Cooperation under the Belt & Road Initiative
Information
Since the establishment of diplomatic relations between China and the five Central Asian countries — Kazakhstan, Kyrgyzstan, Tajikistan, Turkmenistan and Uzbekistan in 1992, the two sides have continued to deepen industrial cooperation in key areas. In 2022, the bilateral trade volume…
The RCEP Signing: Common Future and Shared Prosperity Towards Regional Cooperation
CGTN: 2022 Economic Prospects-Exclusive Interview with Fan Gang
CDI In the News
HK maintains No 3 rank among global financial centers
Hong Kong remained in third place in the global ranking of financial centers, following New York City and London, according to the latest Global Financial Centers Index.
Despite the impact of the COVID-19 pandemic, Hong Kong scored 715 points, only one point less than its previous ranking half a year earlier. List-topper New York lost three points to score 759, while London came in second, dropping 14 points to 726.
The GFCI was jointly published on Thursday by the China…
China-Japan industrial cooperation still has big room to grow
China and Japan have large room for cooperation in emerging industries and the two sides should seek complementary development, scholars said on Thursday.
They made the remarks at an online seminar on China-Japan industrial cooperation and development, co-organized by the Shenzhen-based think tank China Development Institute and Beijing-based think tank Pangoal Institution.
"For China and Japan, the space for cooperation in traditional industries is not that large. But in emerging…
Our Partners
CHINA DEVELOPMENT INSTITUTE
CDI Mansion, St.1, Jinhu Rd., Silver Lake, Shenzhen
P.R. China Postal Code: 518029
Phone: +86 755 8241 1011 / 8247 0837
Fax: +86 755 8241 1011 / 8241 0997
Email: carolf@cdi.org.cn | pennyliu@cdi.org.cn
Wechat: cdiorg


