
2021 - Macro Outlook

Growth continues to be weak. In November, industrial output grew 3.8% y/y, down 1.1 pps from Q3, much lower than the growth rates of recent years. Investment is also low, and was up 7.9% y/y, and down 1.2 pps from January-June. Its adjusted growth rate is instead negative. The real estate market is still cold: sales were down -14.2% y/y in November.
Consumption rose 3.9% y/y in November, down 1 pps from October, and its adjusted growth rate was 0.5% y/y, hitting its lowest level this year. But trade is still strong. Imports were up 26% y/y, and up 9.8 pps from Q3. Exports were up16.6% y/y.
Producer price growth finally reversed to a downward trend. The price level of the index of ex-factory industrial goods was the same as in October, and up 12.9% y/y, down 0.6 pps from October. PPI increased 1% m/m, 17.4% y/y from October, up 0.3 pps from October. We expect PPI growth to be slower next month. In November, CPI rose 2.3% y/y, up 0.8 pps from October. Its adjusted growth rate is the same as in October.
Principal financial indicators operated at low levels in November. M2 rose 8.5% y/y, comparable with 2018 and 2019. M1 rose 3%, up only 0.2 pps from the lowest growth rate this year. There is still uncertainty over whether money growth’s downward trend will be reversed. Loan growth has been at its lowest since 1990, for three consecutive months.
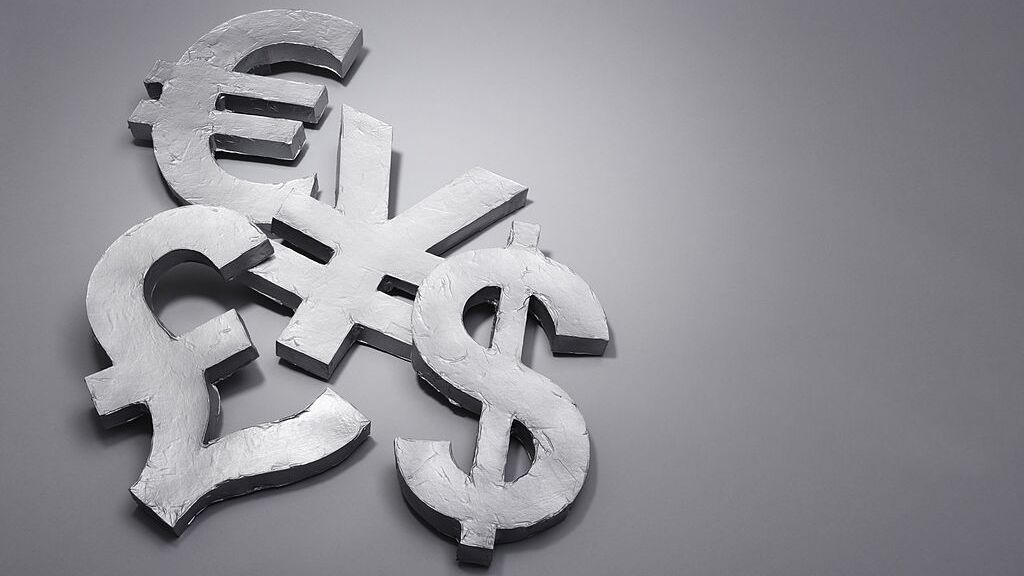
The yuan has risen 2.6% against the dollar this year, even with the dollar strengthening 8% since May. This is in contrast to an unexpectedly weaker Chinese economy, and to real estate risks highlighted in the news headlines. Appreciation is likely due to strong export and investor confidence. We expect that the yuan may appreciate mildly in 2022, and that it won’t fall below 6 against the dollar. This is based on an expected stronger dollar, and expectations of further growth slowdown in China in 2022.
Growth has weakened, especially in services. In August, industrial output grew 5.3% y/y, and was up 11.2% from August 2019, with an annualized growth rate of 5.4%, down 0.2 ppts from July, and down 1.2 ppts from Q2. The service production index has slowed since Q2, and grew only 4.8% y/y in August, after being further hit by the COVID outbreaks, down 2.9 ppts from Q4 2020, and down 2.1 ppts from 2019.
Investment was up 8.9% y/y January-August, and increased 8% from August 2019, with an annualized growth rate of 4%, down 0.5 ppt from H1. Real estate is cooling dramatically, to the 2008 financial crisis level. COVID outbreaks in August negatively impacted consumption. Retail sales of social consumption goods rose 2.5% y/y, down 6 ppts from July. Their growth rate after price adjustment was 0.9% y/y. As we forecast, trade became weaker. Exports rose 15.7% y/y, down 4.4 ppts from Q2. Imports rose 23.1% y/y, down 8.5 ppts from Q2.
Producer prices increased further in August. The ex-factory price index of industrial goods rose 9.5% y/y; PPI increased 13.6% y/y, both 0.5 ppts higher from July. However, we forecast that producer price appreciation will stabilize in November, and that prices will begin to fall. CPI rose 0.8% y/y, falling for three consecutive months. We expect the lowering of CPI to be temporary, and to reach around 2%, after food prices stop declining.
In August, monetary policy continued its tightening trend. M2 rose 8.2% y/y, basically stable since April. M1 rose 4.2% y/y, continuing to fall, reaching its the lowest of 2021, down 0.7 ppts from July.
China is announcing intensive policies in specific key areas, to address structural reform. In the financial industry area, President Xi Jinping announced on September 2nd that a third stock exchange in Beijing would be established, in addition to the existing two exchanges in Shanghai and Shenzhen, to serve small and medium-sized businesses. In regional policies, Shenzhen’s Qianhai and Zhuhai’s Hengqin areas are being pushed to deepen their ties with bordering Hong Kong and Macau. The Qianhai economic zone is to expand eightfold. There are also other new industry rules for the real estate and education sectors. All of these plans underscore the central government’s effort to develop a healthier economy, by being more open and more market-based. But policy uncertainty looms over investment in the short term. The possible default of real estate companies such as Evergrande also raises some fear of turmoil in China’s financial market. But we do not see this as a systematic threat.
The Chinese economy has been stably rising in Q2. GDP was up 7.9% y/y, and up 11.4% from Q2 2019, with an annualized growth rate of 5.5%, up 0.5 pps from Q1. Industrial output was up 8.9% y/y, and up 13.7% from Q2 2019, with an annualized growth rate of 6.6% y/y, slightly lower than in Q1 but higher than the pre-pandemic 2019 level; specifically, growth in June was 6.5%.
Investment was up 12.6% y/y, and increased 9.1% from Q2 2019, with an annualized growth rate of 4.4% y/y, up 1.8 pps from Q1, and down 1 pps from 2019. In Q2, retail sales of social consumption goods were up 9.5% from Q2 2019, with an annualized growth rate of 4.6% y/y, up 0.5 pps from Q1. In June, trade continued its strong growth. Exports rose 20.2% y/y, comparable to the average growth rate in March-May, while imports rose 24.4% y/y, up 5 pps from Q1.
Producer price growth slowed in June, but we expect it to pick up soon. The ex-factory price index of industrial goods increased 8.8% y/y, down 0.2 pps from May. CPI rose 1.1% y/y, down 0.2 pps from May, contributed by falling meat prices.
The main financial indicators saw diverging trends in June. The societal financing scale switched from large drops in previous months to positive growth of 7.7% y/y. M1 continues its declining growth trend. At the end of June, M2 rose 8.6% y/y, lower than most of the previous months. M1 rose 5.5% y/y, down 0.6 pps from May.
The pandemic shows no sign of vanishing from the world. This situation makes central banks around the world unlikely to exit from lowered interest rates and other stimulus measures. The vaccine situation in developed countries is much better than in the rest of the world. China’s strong recovery over the past 12 months is mainly derived from exports. This driving growth factor may be weakened by the economic recovery in developed countries, as they resume their production and reduce their demand for China’s exports later this year. China is therefore facing downturn pressures, amid an environment of globally increasing inflation.
Growth was stable in May. Industrial output rose 8.8% y/y, and increased 13.6% from May 2019, with an annualized growth rate of 6.6%. Investment rose 15.4% y/y, and increased 8.5% from May 2019, with an annualized growth rate of 4.2% y/y -- still in a low growth zone.
Consumption has recovered further. In May, retail sales of social consumption goods rose 9.3% y/y from May 2019, with an annualized growth rate of 4.5%, up 0.2 pps from April. Trade has been strong since the beginning of this year, especially for imports, which are growing robustly. In May, imports rose 39.5% y/y. Exports rose 18.1% y/y, down 4.1 pps from April, but still 7.1 pps higher than in Q4 2020.
Producer prices have been appreciating since Q2 2020, and are rising particularly fast this year, most likely from overseas monetary liquidity loosening. In May, the ex-factory price index of industrial output rose 9% y/y. The PPI growth rate reached 12.5% y/y. The growth rates of both were higher than their peak points in 2017 and 2010. In May, CPI rose 1.3% y/y. Although this growth rate is not high, the trend is forming, and picking up.
Monetary and financial indicators kept weakening in May. M2 rose 8.3% y/y. M1 rose 6.1% y/y, down 0.1 pps from April. Saving deposits from non-financial enterprises rose 3.8% y/y, down 1.5 pps from April, reaching their lowest growth rate since 2016.
China’s yuan has strengthened to a near three-year high, reaching 6.4 per dollar on June 21st, boosted by a falling dollar. It has also been buoyed in recent months by the country’s rapid recovery from the pandemic, and by a rush of international investment into China’s relatively high-yielding markets. Chinese stocks also jumped, thanks partly to a surge in foreign buying. A strengthening yuan will bring the current strong exports back to normal. The yuan might still appreciate further with China’s relatively tight monetary policy, in contrast to global monetary loosening, such as the almost zero interest rate in the United States. China’s tightening monetary policy is hardly likely to change, in the face of future global inflation spillover risk.
Growth is stable. Industrial output was up 9.8% y/y in April, and up 14.1% y/y from April 2019, with annualized growth of 6.8% y/y, the same as in Q1, and higher than the pre-pandemic levels in 2018 and 2019. Investment is still weak, and rose 8% y/y from April 2019, with an annualized growth rate of 3.9% y/y, up 1.3 pps from Q1. We expect economic growth to be strong, though fiscal and monetary policy are not loosening. Our forecast is based on strong trade growth from global economic recovery, commodity price appreciation and demand recovery.
Consumption recovered slowly. In April, price-adjusted consumption grew 5.4% y/y from April 2019, with an annualized growth rate of 2.7% y/y. Trade in April continues to be strong. Exports rose 22.2% y/y, up 11 pps from Q4 2020. Imports rose 32.2% y/y, up more than 20 pps from Q4.
Producer prices continue to grow faster. In April, the ex-factory price index of industrial output rose 6.8% y/y, and PPI increased 9% y/y, approaching the peak point in Q1 2017. CPI rose 0.9% y/y, up 0.5 pps from March. Most financial and monetary indicators grew more slowly. At the end of April, M2 rose 8.1% y/y, down 2 pps from the end of 2020. M1 rose 6.2% y/y, down 2.4 pps.
China’s once-in-a-decade population census, with preliminary results announced on May 12th, showed the slowest population growth rate since the 1950s, notwithstanding the relaxation of the one-child policy to a two-child policy in 2016. The census also showed that more Chinese people were moving away from the poorer northeastern part of the country, and to the wealthier eastern and southern regions. For example, Shenzhen and Guangzhou, already among the largest cities previously, gained the most, of 7.13 million and 5.98 million people. The migration to richer and more productive cities, made possible by the relaxation of Hukou, provides a key growth source, simply because labor can be utilized more efficiently.
GDP was up 18.3% y/y in Q1, and up 10.3% from Q1 2019, with an annualized growth rate of around 5%. In this report, we mostly use Q1 2019 as the benchmark period, because the major shock from the pandemic in February 2020 makes Q1 2020 data hardly comparable. The adjusted growth rate was lower than in Q4 2020, and higher than in Q3 2020, and can be viewed as stable.
In Q1 2021, industrial output was up 14% y/y from Q1 2019, with annualized growth of 6.8%, slightly lower than in Q4 2020. In particular, industrial growth in March reached 12.8% y/y, with an annualized growth rate of 6.2% y/y, up 0.4 pps from Q3 2020. In Q1, investment rose 25.6% y/y, and increased only 5.4% from Q1 2019, with an annualized growth rate of 2.6%, much lower than in H2 2020.
In Q1, retail sales of social consumption goods rose 33.9% y/y, and were up 8.5% from Q1 2019, with an annualized growth rate of 4.1%, indicating that consumption is still on its way to recovery. In Q1, imports rallied, and grew 19.2% y/y, up 19.3 pps from Q4 2020. Exports increased 16.5% from Q1 2019. The adjusted growth rate is comparable to H2 2020, and is at high levels for recent years.
In Q1, producer prices continue to increase, and the growth rates are high. In March, the ex-factory price index and PPI saw growth reach 4.4% and 5.2% y/y, up 4.8 pps and 5.2 pps from December 2020. This is mainly driven by strong demand for commodities from other countries’ economic recoveries. CPI is instead basically stable. Money and financial indicators grew more slowly. At the end of March, M2 was up 9.4% y/y, down 1.5 pps from its peak last year. M1 was up 7.1% y/y, and has decreased 2.9 pps over four consecutive months.
Postponing the retirement age will be on the Chinese government’s agenda, according to announcement made March 22nd, with further details released on April 13th. China’s aging problem is severe, and population growth is on a steep declining trend, and has attracted great attention. The takeaway from the statement on postponing retirement age is that the delay is to be gradual, and experimental. It will alleviate the negative effects of slower population growth. Population aging and slower growth mainly negatively affect GDP, but not necessarily in per capita terms, due to China’s high savings rate, and financially rich central government.

Economic recovery is still going strong. In January-February, industrial output was up 35.1% y/y, and up 16.9% compared to January-February 2019. Annualized growth was 8.1% y/y, higher than all quarterly growth since 2015, and up 1 pps from Q4 2020. Since the Chinese economy was shut down to a large extent last February due to COVID-19, we also look at growth rates for most indicators by comparing their performance with the same period in 2019.
In January-February, investment fell -35% y/y, and was up only 3.5% y/y from the same period in 2019. The investment slowdown is mostly due to the central government’s intention to cool the economy.
Trade is strong, as we forecast. In January-February, exports were up 50.1% y/y, and increased by 26.2% from same period in 2019, and up 9 pps from Q4 2020. Imports were up 14.5% y/y. The adjusted growth rate was around 12% y/y, up 12.1 pps from Q4.
Producer prices rose faster. In February, the ex-factory price index of industrial goods was up 1.7% y/y, and up 1.4 pps from January. The PPI was up 2.4% y/y, and up 1.5 pps from January. The CPI fell -0.2% y/y, up 0.1 pps from January. Monetary policy has returned to normal. At the end of February, M2 was up 10.1% y/y, the same rate as the end of last year, and down 1 pps from the peak last year. M1 rose 7.4%, down 2.6 pps from the peak last year, and it has declined rapidly since November.
Consumption is the only weak indicator. In January-February, retail sales of social consumption goods were up 33.8% y/y, up 6.4% from same period in 2019, and up 1.8 pps from Q4 2020, indicating consumption demand is still on a path of recovery.
On March 23rd, Premier Li Keqiang said that China’s economic growth this year could exceed a target of “above 6%,” with the government seeking stable expansion and job creation, emphasizing consumption. Consumption inequality, which is closely related to income and wealth equality, rose last year. With the premier’s effort and return to normal monetary policy, we believe consumption as well as the much-related imports will rise this year.

Producer prices increased fast between June 2020 and January 2021, and finally turned positive. The ex-factory price index of industrial goods rose 1% m/m, and 0.3% y/y. PPI rose 1.4% m/m, and 0.9% y/y. We expect the ex-factory price index to soon rise higher than 5% y/y, and PPI will rise higher than 8% y/y.
CPI fell -0.3% y/y. However, its seasonally adjusted growth rate was 0.3% m/m. The rise of the CPI level is mainly driven by the strong rebound of meat prices. The rebound is temporary, and linked to the Spring Festival effect. We expect the meat price will continuously drop for the next few months, and for CPI growth to slow as well.
Monetary and financial indicators cooled further. In January, M2 rose 9.4% y/y, down 0.7 pps from December. M1 rose 14.7% y/y, and 10% y/y after taking out the Spring Festival effect. RMB loans from financial institutions rose 12.7% y/y, down 0.1 pps from December. Savings deposits from non-financial institutions rose 15.8% y/y and deposits’ adjusted growth rate was lower than 12% y/y. Because the broad money supply was not affected by the Spring Festival effect, their growth rate declines show that the overall money and financial situation continue their declining trend.
PMI fell. In January 2021, PMI was 51.3%, down 0.6 pps from December 2020. The non-manufacturing business activity index was 52.4% y/y, down 3.3 pps from December. The two indexes show that expansion trends for both manufacturing and non-manufacturing industries have slowed.
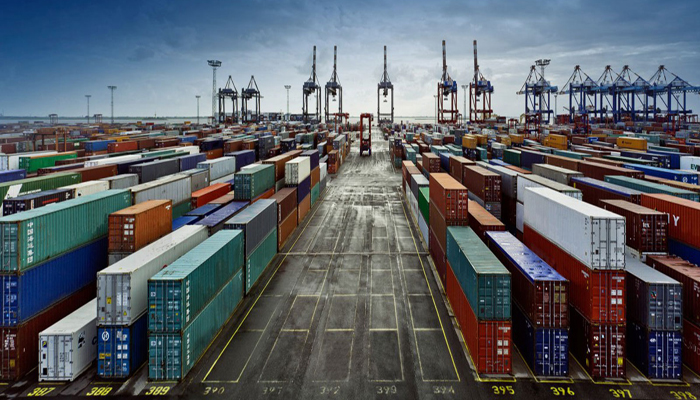
Chinese exports have been strong since 2020. For example, China overtookthe United States as Europe’s top trade partner in 2020. Even though pandemic-related goods comprise a sizable share, other categories’ exports are also rising. Strong export growth, with production interruption in the rest of the world because of the pandemic, shows China’s economic resilience. The resumption of overseas production, if the pandemic is under control, will lift Chinese exports of capital and intermediate goods. Moreover, the import demand from the United States had been strong since 2020, and will likely be large, given the incoming stimulus. In sum, robust export performance will persist, and we expect export growth in the first half of 2021 to be 16%.
")
")
")
")
")
")
")
")