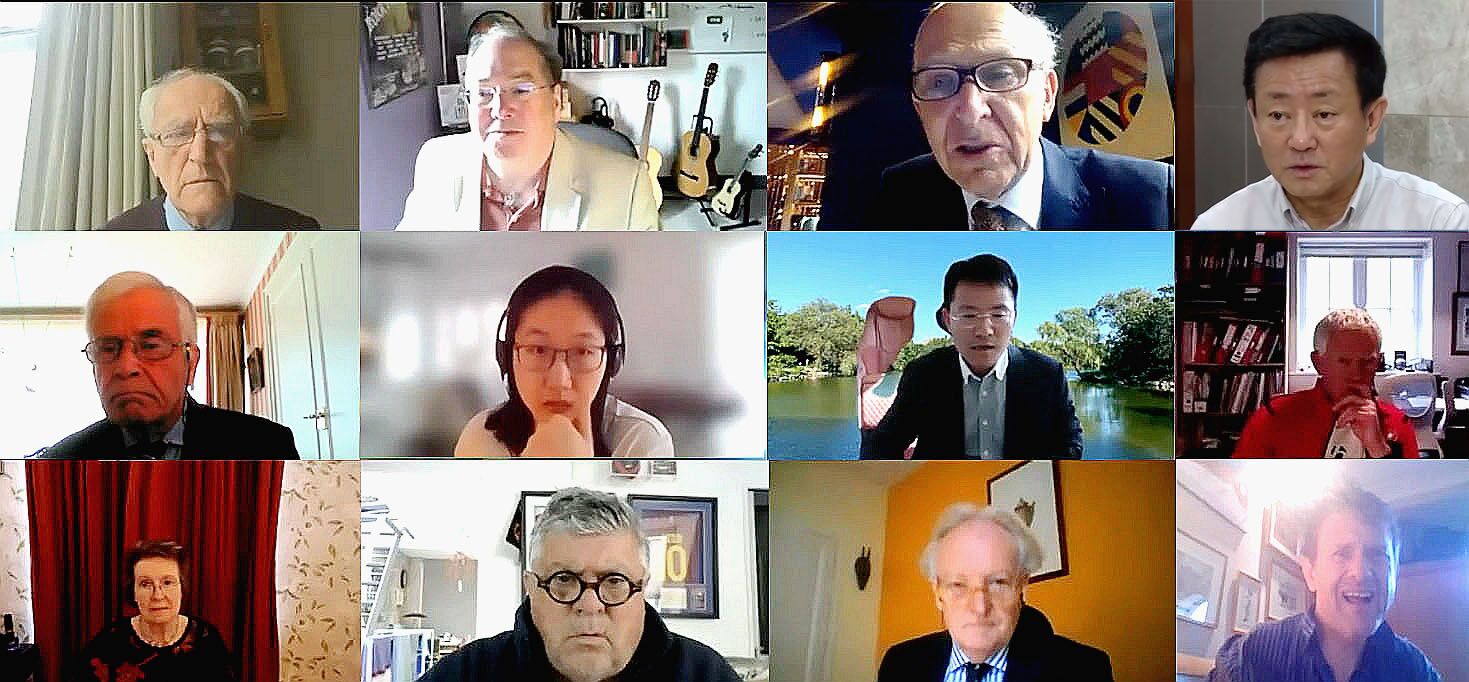
CDI 2021 Annual Meeting in Beijing
Information
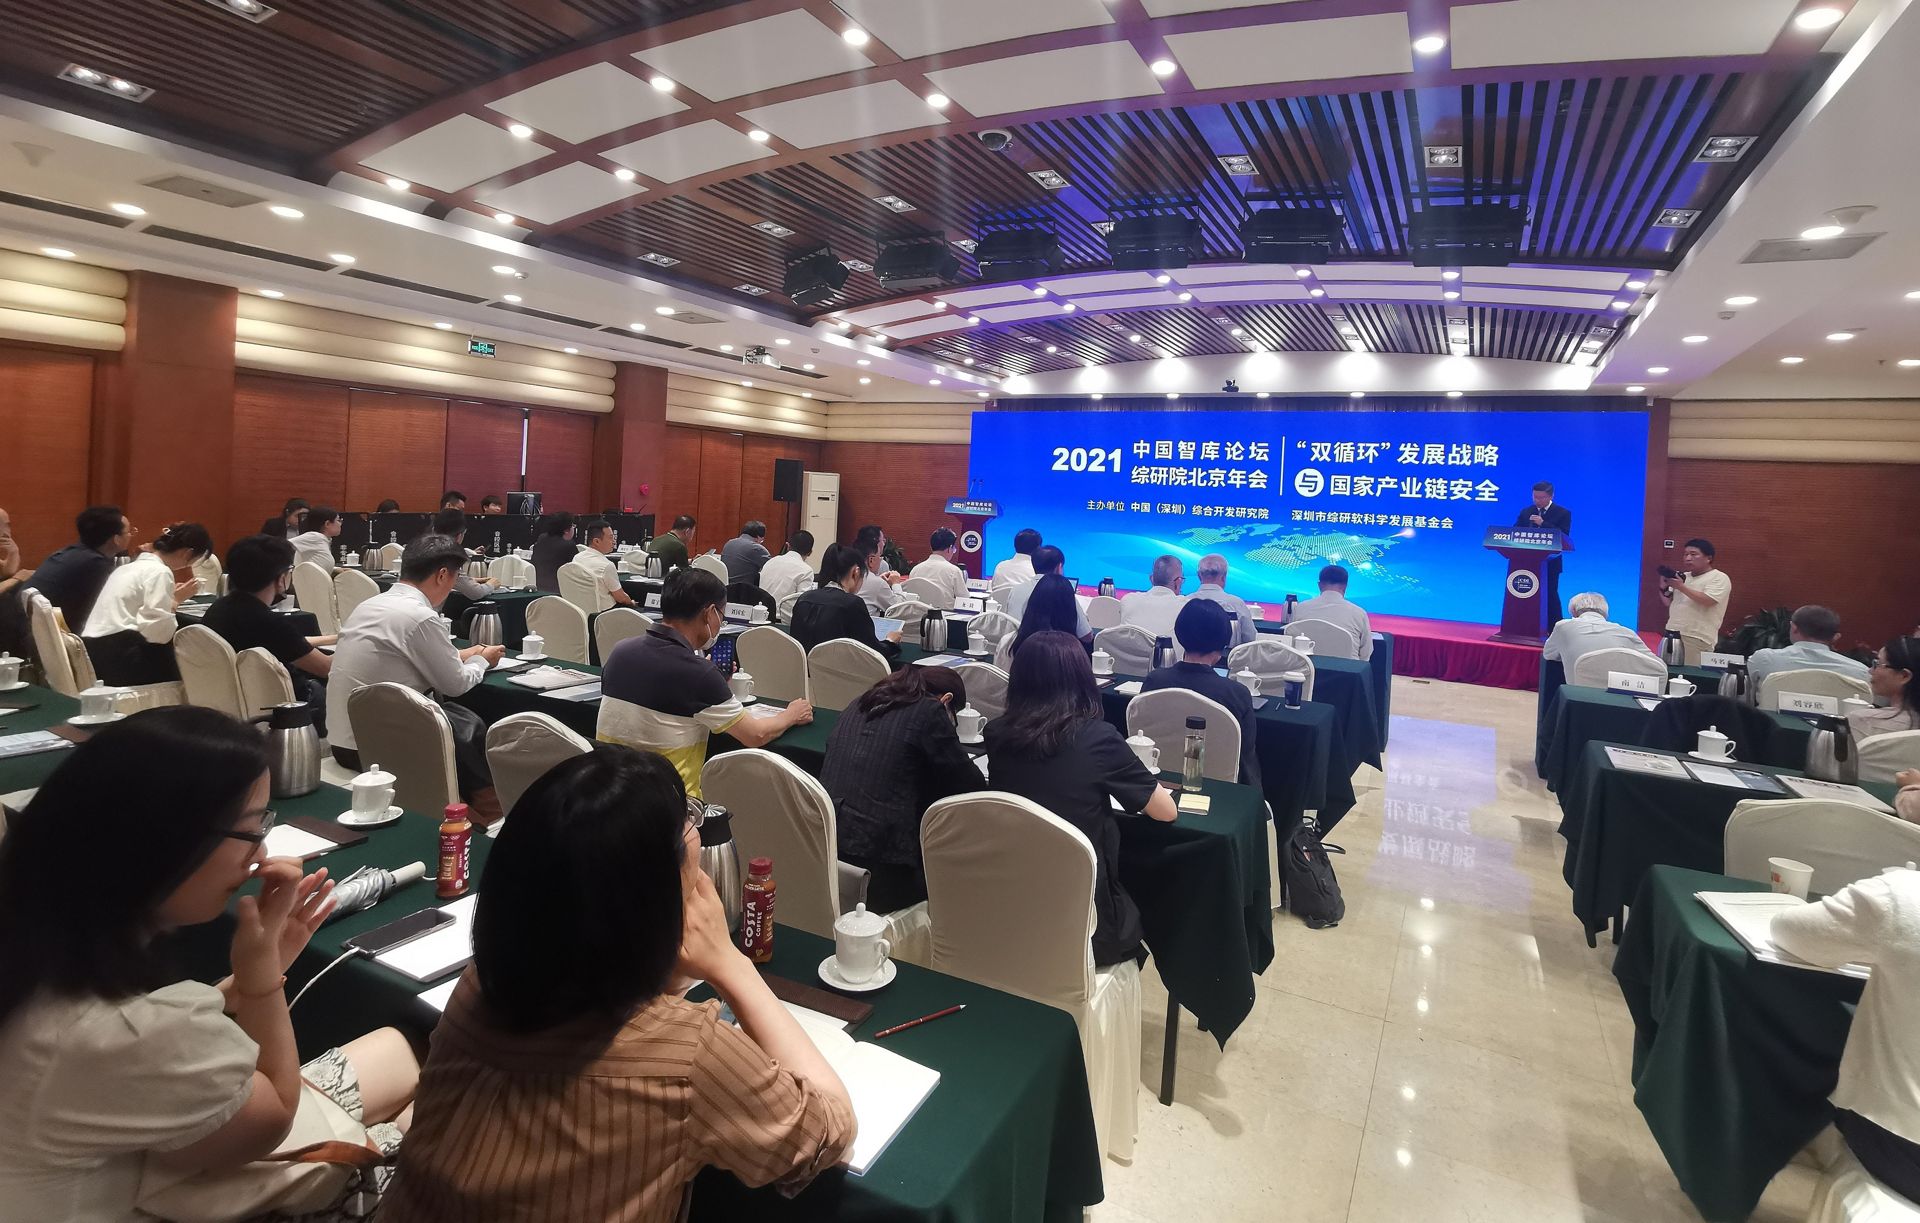
As international trade and production undergo disruption caused by the global pandemic, international industrial chain is bound for comprehensive restructuring. During which, China’s economic development will be faced with a serious of risks and challenges. With this in mind, CDI’s 2021 China Think Tank Forum aims to debate how China’s industry chain should adjust and adapt to the rapidly changing external economic environment while creating a fair and innovation-friendly internal business environment.
Date: July 23, 2021
Venue: China Hall of Science and Technology, Beijing
Host: CDI, Shenzhen Soft Science Development Foundation
Theme: “Dual Circulation” Economic Model and National Supply Chain Security


Seminar on Hong Kong-Shenzhen Biotechnology Collaboration and Launch of Joint Report
Information
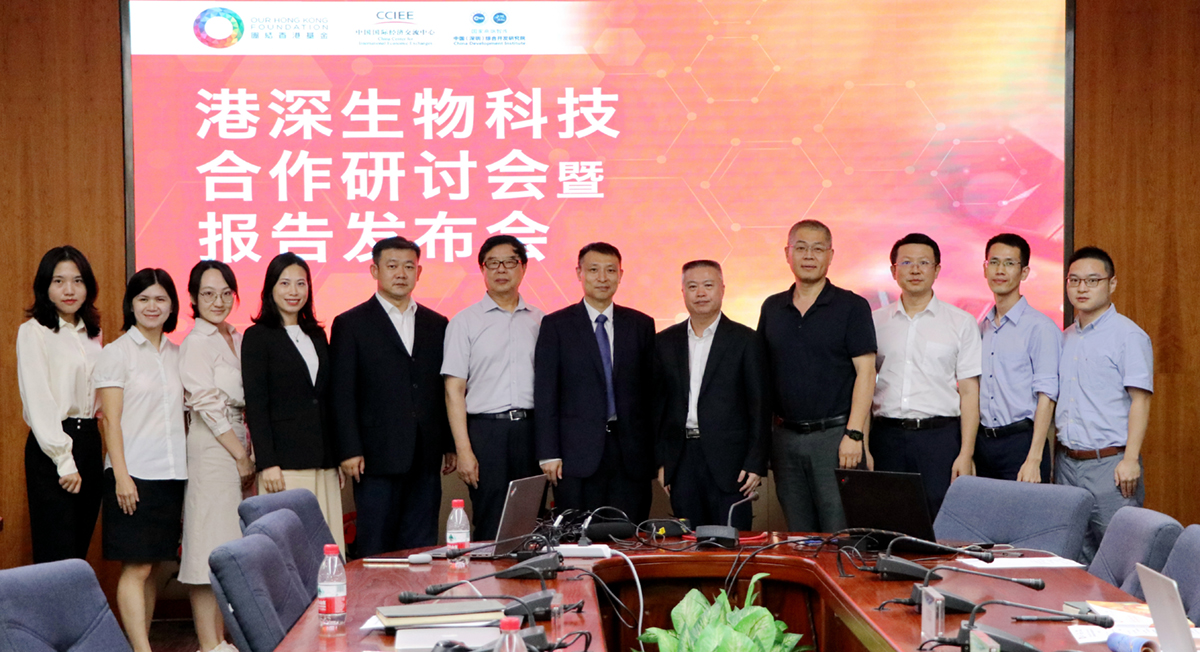
China Development Institute, China Center for International Economic Exchanges and Our Hong Kong Foundation jointly conducted research on the strategy for collaboration between Hong Kong and Shenzhen in biotechnology development by leveraging the synergistic effects of the Shenzhen-Hong Kong Cooperation Zone for Technology and Innovation at the Lok Ma Chau Loop.
To foster the growth of a world-class biotech cluster, the three think tanks in their report, entitled Strategic Collaborations between Hong Kong and Shenzhen in Biotechnology—Capitalising Opportunities in the Loop for Policy Innovations, puts forward seven recommendations, including bringing in leading biotechnology corporations, establishing a mega research institute, developing comprehensive supporting facilities for the entire supply chain, and providing a one-stop service platform to advance biotechnology development in Lok Ma Chau Loop.
On July 26, 2021, the three think tanks bring together government officials, academics and industry leaders in the discussion of the outlook of Hong Kong-Shenzhen biotechnology collaboration, and jointly release the research report.
Date: July 26, 2021
Venue: Shenzhen, Beijing and Hong Kong
Host: CDI, China Center for International Economic Exchanges and Our Hong Kong Foundation
Theme: Strategic Collaborations between Hong Kong and Shenzhen in Biotechnology—Capitalising Opportunities in the Loop for Policy Innovations


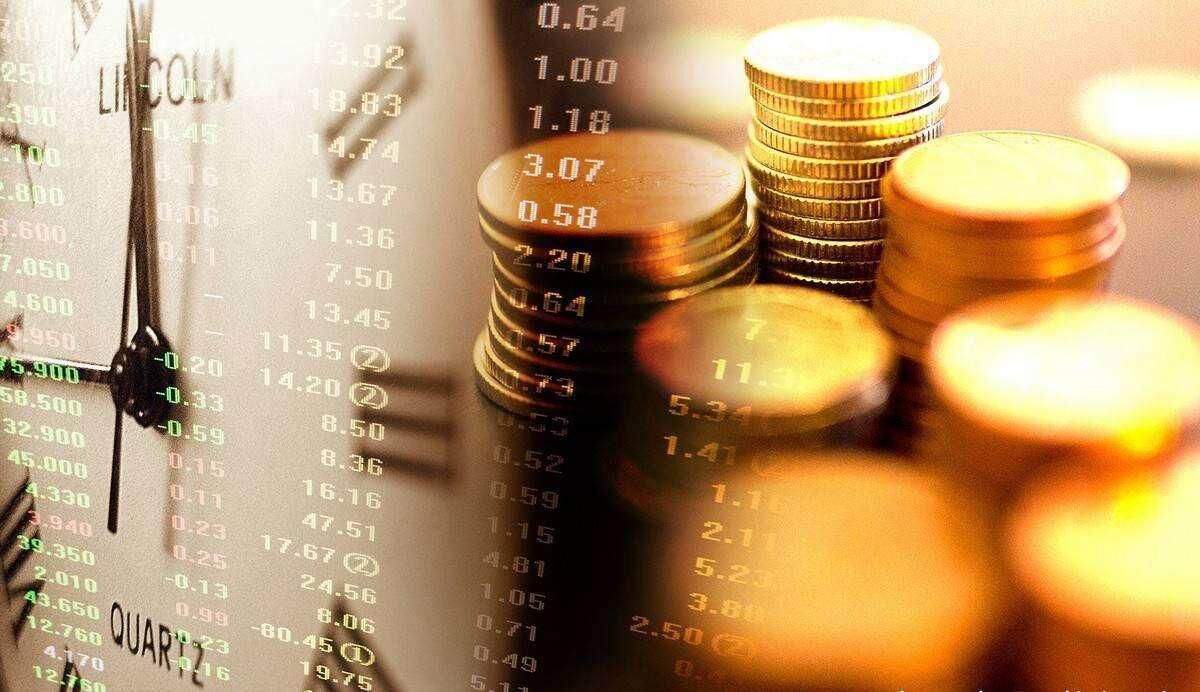
Growth may be slower
The Chinese economy has been stably rising in Q2. GDP was up 7.9% y/y, and up 11.4% from Q2 2019, with an annualized growth rate of 5.5%, up 0.5 pps from Q1. Industrial output was up 8.9% y/y, and up 13.7% from Q2 2019, with an annualized growth rate of 6.6% y/y, slightly lower than in Q1 but higher than the pre-pandemic 2019 level; specifically, growth in June was 6.5%.
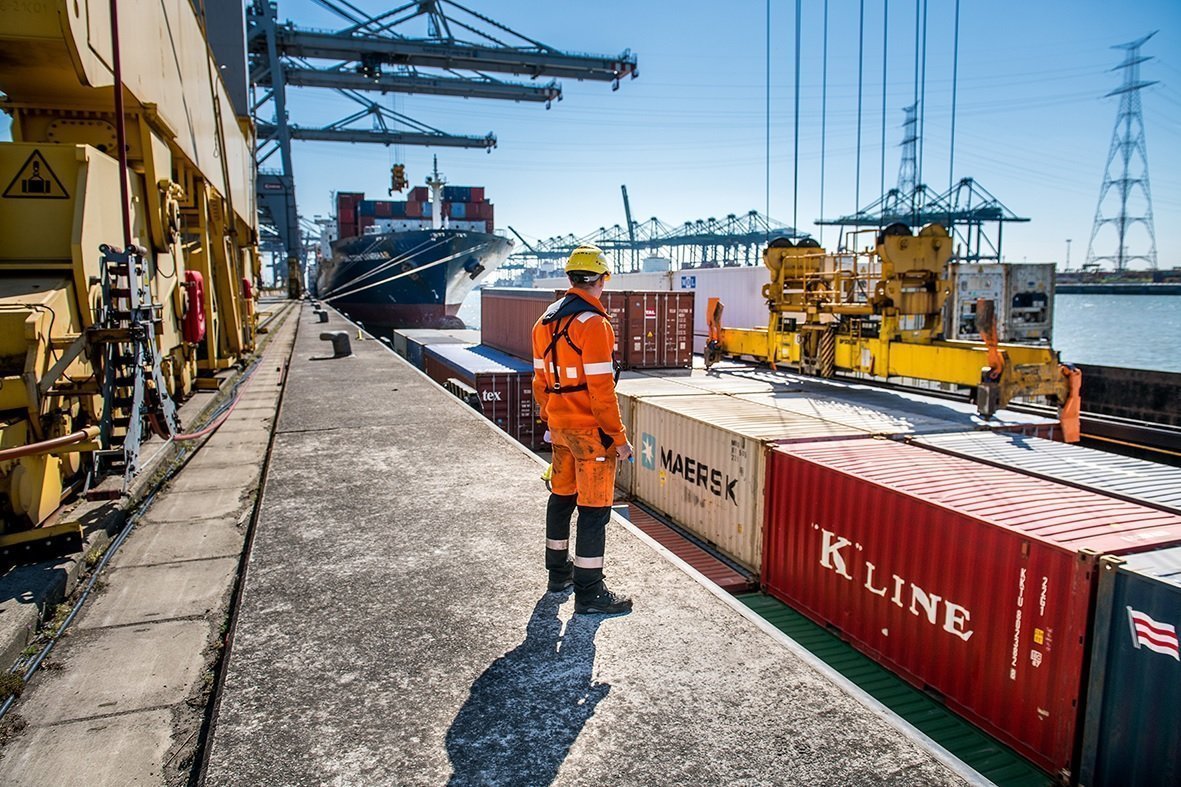
Investment was up 12.6% y/y, and increased 9.1% from Q2 2019, with an annualized growth rate of 4.4% y/y, up 1.8 pps from Q1, and down 1 pps from 2019. In Q2, retail sales of social consumption goods were up 9.5% from Q2 2019, with an annualized growth rate of 4.6% y/y, up 0.5 pps from Q1. In June, trade continued its strong growth. Exports rose 20.2% y/y, comparable to the average growth rate in March-May, while imports rose 24.4% y/y, up 5 pps from Q1.
Producer price growth slowed in June, but we expect it to pick up soon. The ex-factory price index of industrial goods increased 8.8% y/y, down 0.2 pps from May. CPI rose 1.1% y/y, down 0.2 pps from May, contributed by falling meat prices.
The main financial indicators saw diverging trends in June. The societal financing scale switched from large drops in previous months to positive growth of 7.7% y/y. M1 continues its declining growth trend. At the end of June, M2 rose 8.6% y/y, lower than most of the previous months. M1 rose 5.5% y/y, down 0.6 pps from May.
The pandemic shows no sign of vanishing from the world. This situation makes central banks around the world unlikely to exit from lowered interest rates and other stimulus measures. The vaccine situation in developed countries is much better than in the rest of the world. China’s strong recovery over the past 12 months is mainly derived from exports. This driving growth factor may be weakened by the economic recovery in developed countries, as they resume their production and reduce their demand for China’s exports later this year. China is therefore facing downturn pressures, amid an environment of globally increasing inflation.
Financial Centre Futures Webclave Looking Forward To COP 26
Information
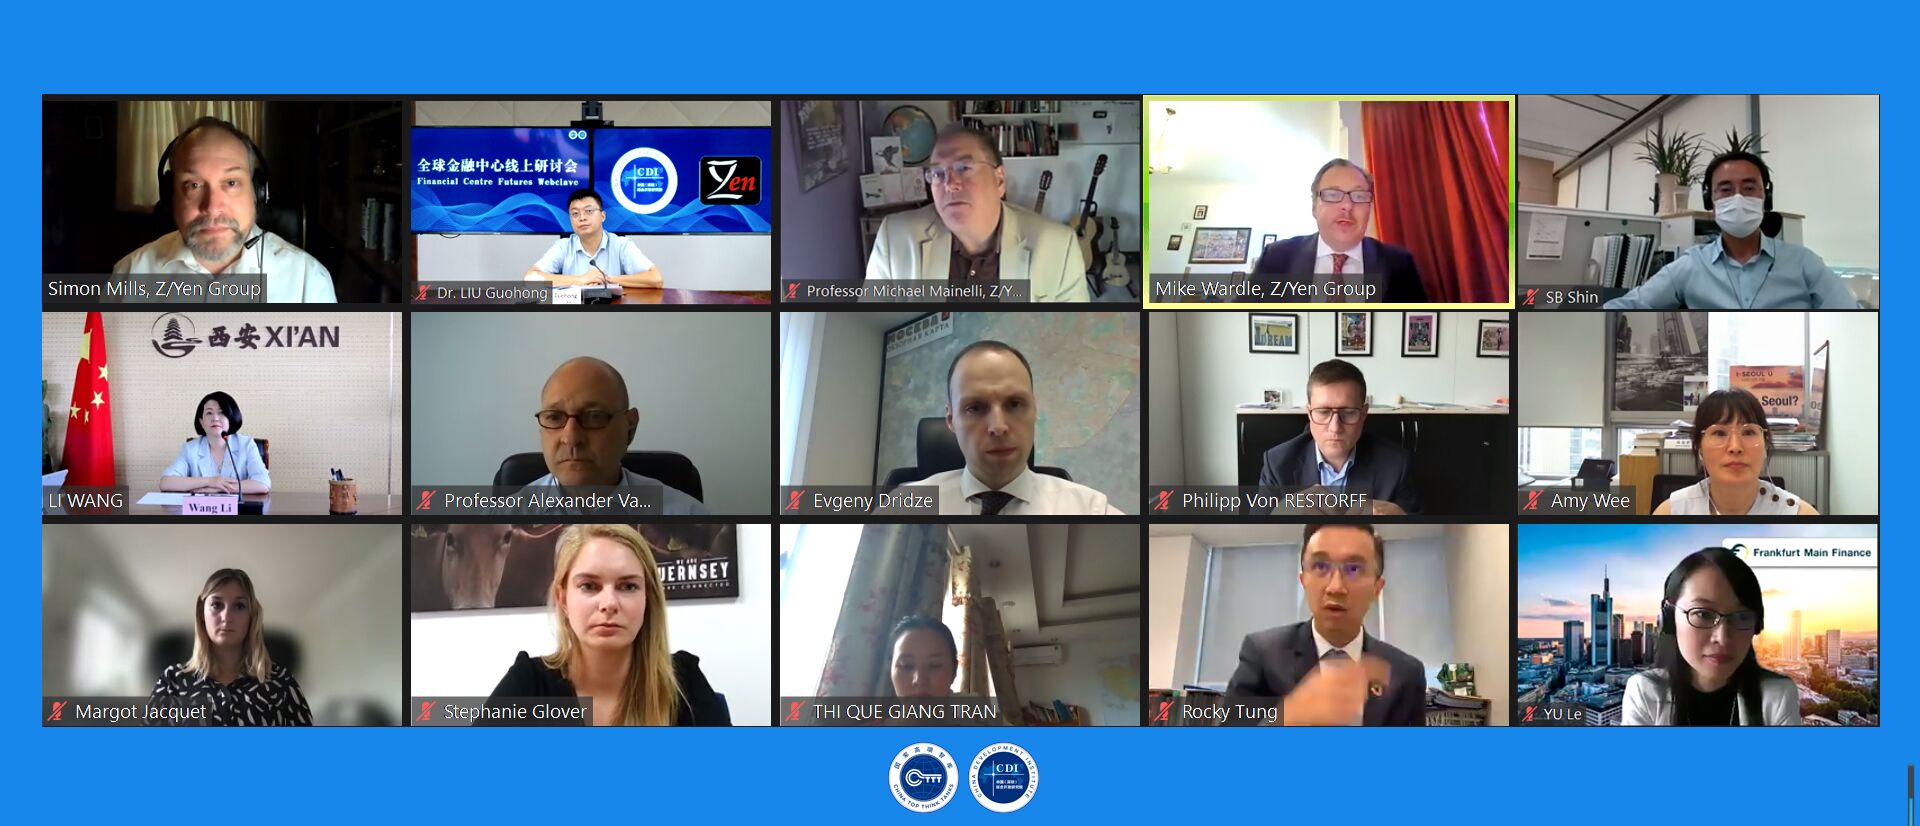
On July 29th, China Development Institute, in partnership with the Z/Yen Group, is holding a special webclave to bring together representatives of financial centres across the world to discuss areas of common interest and in particular the contribution made by financial centres to the Sustainable Development Goals in advance of COP 26.
In the lead up to COP 26, the meeting is an opportunity for financial centres to share information on: What are the challenges that financial centres are working on in relation to the UN SDGs? What do financial centres see as the biggest strategic challenges ahead? How will financial centres measure success going forward?
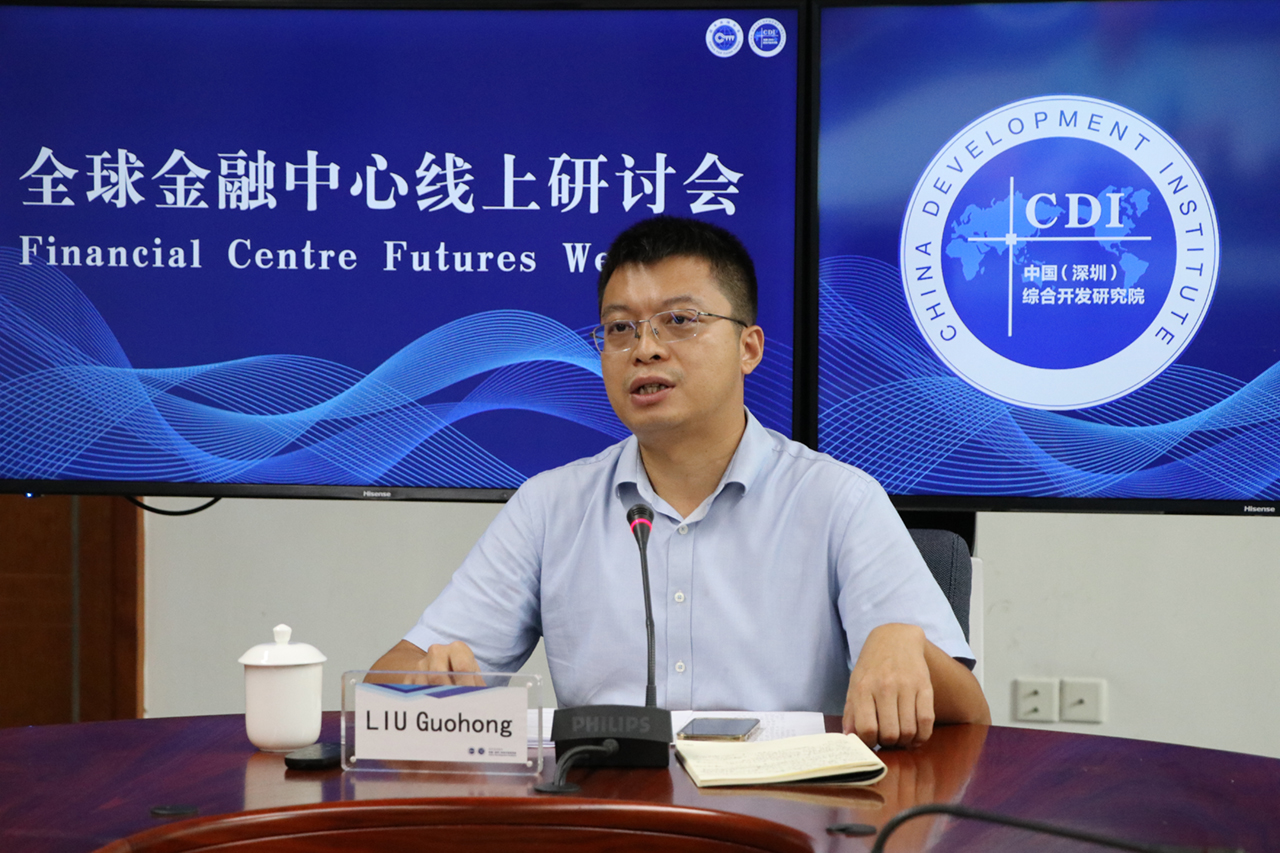
Date: Thursday, 29 July 2021
Time: 15:30-17:30 (GMT+8)
Stronger yuan against a weak dollar
Growth was stable in May. Industrial output rose 8.8% y/y, and increased 13.6% from May 2019, with an annualized growth rate of 6.6%. Investment rose 15.4% y/y, and increased 8.5% from May 2019, with an annualized growth rate of 4.2% y/y -- still in a low growth zone.
Consumption has recovered further. In May, retail sales of social consumption goods rose 9.3% y/y from May 2019, with an annualized growth rate of 4.5%, up 0.2 pps from April. Trade has been strong since the beginning of this year, especially for imports, which are growing robustly. In May, imports rose 39.5% y/y. Exports rose 18.1% y/y, down 4.1 pps from April, but still 7.1 pps higher than in Q4 2020.
Producer prices have been appreciating since Q2 2020, and are rising particularly fast this year, most likely from overseas monetary liquidity loosening. In May, the ex-factory price index of industrial output rose 9% y/y. The PPI growth rate reached 12.5% y/y. The growth rates of both were higher than their peak points in 2017 and 2010. In May, CPI rose 1.3% y/y. Although this growth rate is not high, the trend is forming, and picking up.
Monetary and financial indicators kept weakening in May. M2 rose 8.3% y/y. M1 rose 6.1% y/y, down 0.1 pps from April. Saving deposits from non-financial enterprises rose 3.8% y/y, down 1.5 pps from April, reaching their lowest growth rate since 2016.
China’s yuan has strengthened to a near three-year high, reaching 6.4 per dollar on June 21st, boosted by a falling dollar. It has also been buoyed in recent months by the country’s rapid recovery from the pandemic, and by a rush of international investment into China’s relatively high-yielding markets. Chinese stocks also jumped, thanks partly to a surge in foreign buying. A strengthening yuan will bring the current strong exports back to normal. The yuan might still appreciate further with China’s relatively tight monetary policy, in contrast to global monetary loosening, such as the almost zero interest rate in the United States. China’s tightening monetary policy is hardly likely to change, in the face of future global inflation spillover risk.
The RCEP Signing: Common Future and Shared Prosperity Towards Regional Cooperation
Information
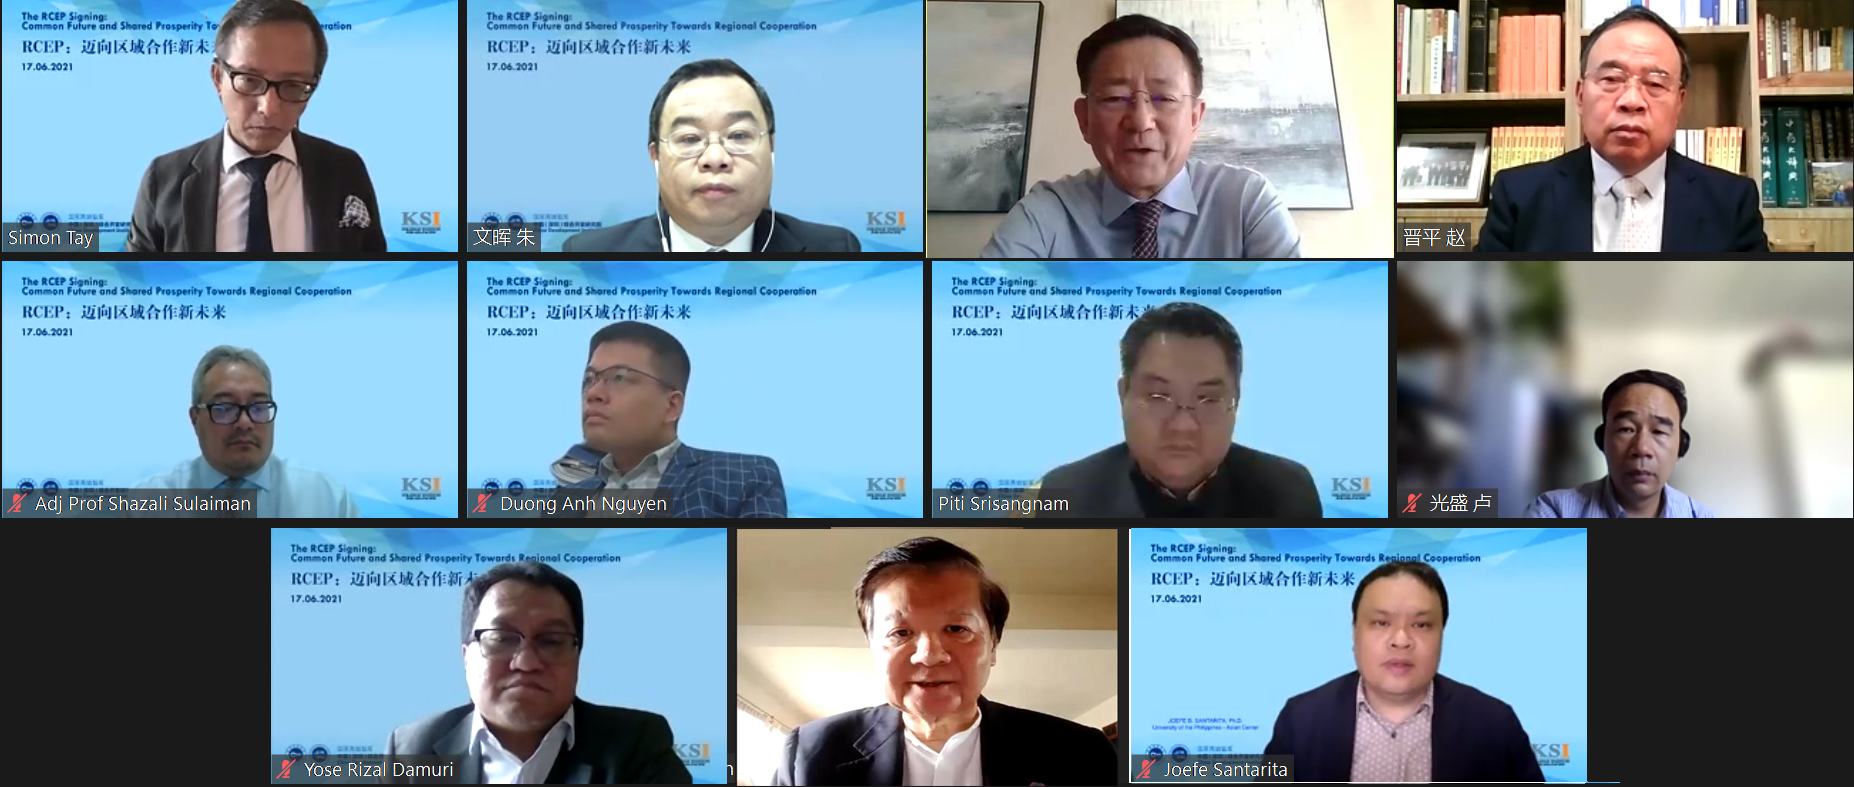
The year 2021 not only marks the 30th anniversary of China-ASEAN dialogue and relations, but also witnesses the steady progress of the Regional Comprehensive Economic Partnership (RCEP). Once implemented, the RCEP is expected to significantly eliminate tariffs between its signatory nations, and further promote regional value chains, trade, and intellectual property. The RCEP will help form a more secure and diversified supply chain, while facilitating closer regional economic and social connections.
On June 17th, China Development Institute and KSI Strategic Institute for Asia Pacific jointly held a webinar, bring together public representatives, academics, and professionals in the hope of providing insights into the next steps for regional economic cooperation and the RCEP’s complementary role to the Belt and Road Initiative (BRI).
Date: Thursday, 17 June 2021
Time: 14:30 (GMT+8)
New Zealand Ambassador to China visits CDI
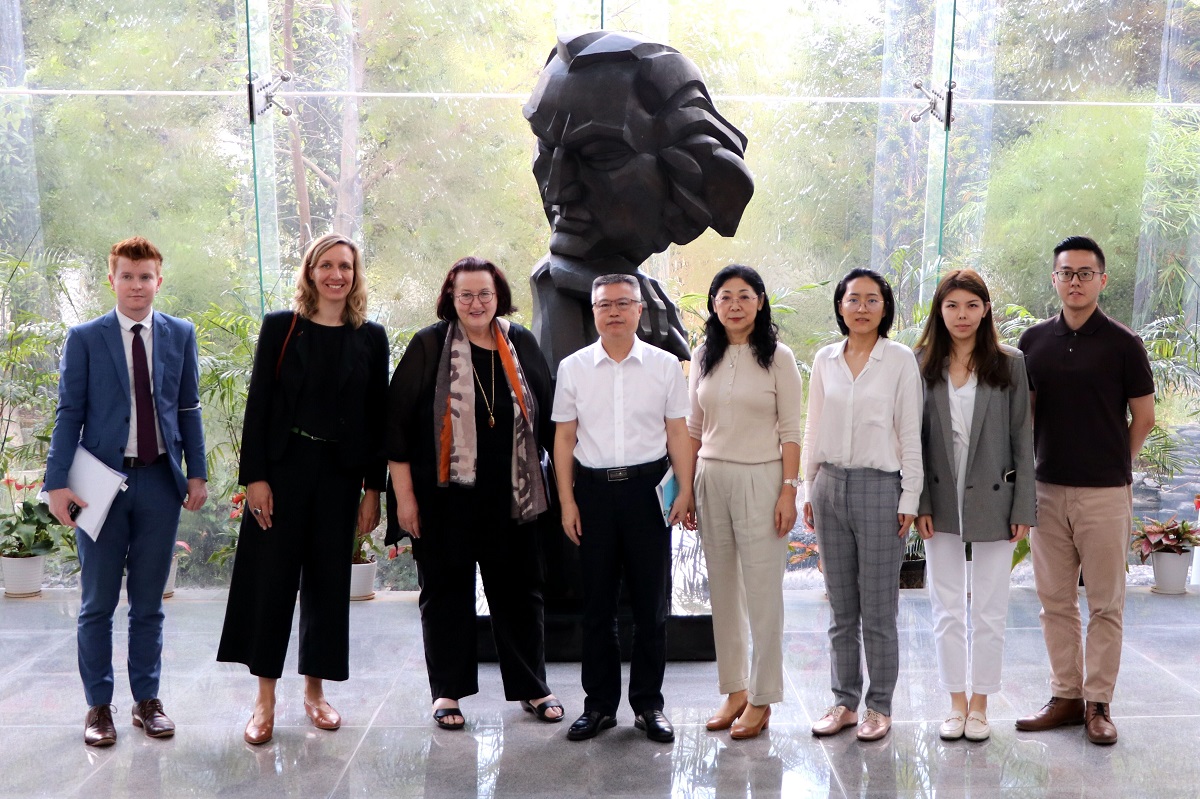
On May 19, H.E. Clare Fearnley, the New Zealand Ambassador to China, led delegation to China Development Institute and was greeted by Executive Vice President Dr. Guo Wanda. The two parties exchanged views on Guangdong-Hong Kong-Macau Greater Bay Area (GBA)’s role in the “dual circulation” development model, Shenzhen’s role in the GBA plan and its economic outlook, as well as the current status and future implication of China’s digital currency.
Robust growth without monetary loosening
Growth is stable. Industrial output was up 9.8% y/y in April, and up 14.1% y/y from April 2019, with annualized growth of 6.8% y/y, the same as in Q1, and higher than the pre-pandemic levels in 2018 and 2019. Investment is still weak, and rose 8% y/y from April 2019, with an annualized growth rate of 3.9% y/y, up 1.3 pps from Q1. We expect economic growth to be strong, though fiscal and monetary policy are not loosening. Our forecast is based on strong trade growth from global economic recovery, commodity price appreciation and demand recovery.
Consumption recovered slowly. In April, price-adjusted consumption grew 5.4% y/y from April 2019, with an annualized growth rate of 2.7% y/y. Trade in April continues to be strong. Exports rose 22.2% y/y, up 11 pps from Q4 2020. Imports rose 32.2% y/y, up more than 20 pps from Q4.
Producer prices continue to grow faster. In April, the ex-factory price index of industrial output rose 6.8% y/y, and PPI increased 9% y/y, approaching the peak point in Q1 2017. CPI rose 0.9% y/y, up 0.5 pps from March. Most financial and monetary indicators grew more slowly. At the end of April, M2 rose 8.1% y/y, down 2 pps from the end of 2020. M1 rose 6.2% y/y, down 2.4 pps.
China’s once-in-a-decade population census, with preliminary results announced on May 12th, showed the slowest population growth rate since the 1950s, notwithstanding the relaxation of the one-child policy to a two-child policy in 2016. The census also showed that more Chinese people were moving away from the poorer northeastern part of the country, and to the wealthier eastern and southern regions. For example, Shenzhen and Guangzhou, already among the largest cities previously, gained the most, of 7.13 million and 5.98 million people. The migration to richer and more productive cities, made possible by the relaxation of Hukou, provides a key growth source, simply because labor can be utilized more efficiently.
China-UK-Europe Relationships & Co-operation After Brexit: Rewiring the Connections
Information
China Development Institute (CDI) and Z/Yen are hosting an online expert seminar to take place on 20 May 2021, with a focus on UK-China-Europe Relationships and Co-operation After Brexit.
The objectives of the event:
The future of cooperation in capital markets between China-UK-EU
The trends of regional financial development in Europe
Opportunities and issues that arise for the future.
Date: Thursday, 20 May 2021
Time: 16:00 China, 09:00 London


Import rally
GDP was up 18.3% y/y in Q1, and up 10.3% from Q1 2019, with an annualized growth rate of around 5%. In this report, we mostly use Q1 2019 as the benchmark period, because the major shock from the pandemic in February 2020 makes Q1 2020 data hardly comparable. The adjusted growth rate was lower than in Q4 2020, and higher than in Q3 2020, and can be viewed as stable.
In Q1 2021, industrial output was up 14% y/y from Q1 2019, with annualized growth of 6.8%, slightly lower than in Q4 2020. In particular, industrial growth in March reached 12.8% y/y, with an annualized growth rate of 6.2% y/y, up 0.4 pps from Q3 2020. In Q1, investment rose 25.6% y/y, and increased only 5.4% from Q1 2019, with an annualized growth rate of 2.6%, much lower than in H2 2020.
In Q1, retail sales of social consumption goods rose 33.9% y/y, and were up 8.5% from Q1 2019, with an annualized growth rate of 4.1%, indicating that consumption is still on its way to recovery. In Q1, imports rallied, and grew 19.2% y/y, up 19.3 pps from Q4 2020. Exports increased 16.5% from Q1 2019. The adjusted growth rate is comparable to H2 2020, and is at high levels for recent years.
In Q1, producer prices continue to increase, and the growth rates are high. In March, the ex-factory price index and PPI saw growth reach 4.4% and 5.2% y/y, up 4.8 pps and 5.2 pps from December 2020. This is mainly driven by strong demand for commodities from other countries’ economic recoveries. CPI is instead basically stable. Money and financial indicators grew more slowly. At the end of March, M2 was up 9.4% y/y, down 1.5 pps from its peak last year. M1 was up 7.1% y/y, and has decreased 2.9 pps over four consecutive months.
Postponing the retirement age will be on the Chinese government’s agenda, according to announcement made March 22nd, with further details released on April 13th. China’s aging problem is severe, and population growth is on a steep declining trend, and has attracted great attention. The takeaway from the statement on postponing retirement age is that the delay is to be gradual, and experimental. It will alleviate the negative effects of slower population growth. Population aging and slower growth mainly negatively affect GDP, but not necessarily in per capita terms, due to China’s high savings rate, and financially rich central government.
")
")
")
")
")
")
")
")