
2020 - Macro Outlook
Industrial output rose 7% y/y in November, reaching its fastest growth rate since April. Investment rose 2.6% y/y, and was up 0.8 pps from October.
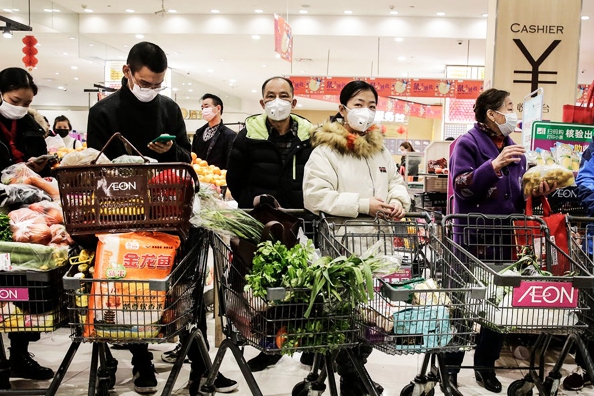
Consumption was the worst-hit macro variable of the pandemic. But retail sales of consumer goods recovered further, rising 5% y/y, up 0.7 pps from October. Its real growth rate was 6.2% y/y, and was even higher than in November 2019.
CPI fell -0.5% y/y in November, turning negative for the first time, hit by a fall in pork prices. The ex-factory price index of industrial output fell -1.5% y/y, and PPI fell -1.6% y/y, up 0.6 and 0.8 pps respectively from October.
Most financial and monetary indicators halted their rising trends, except for M1. As of the end of November, M1 was up 10% y/y, and up 0.9 pps from October, reaching its highest growth rate since February 2018.
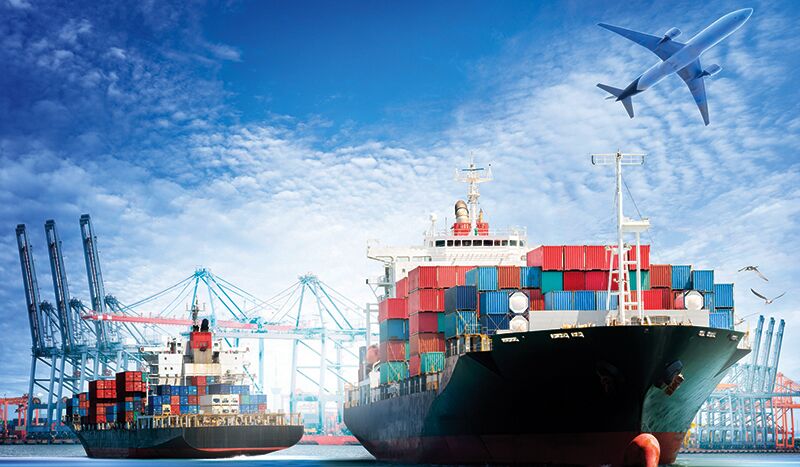
Exports are surging, and rose 14.9% y/y, and 4.7 pps from Q3. Exports to the United States and Canada were particularly strong, rising 38.6% and 52.4% y/y, up 19.4 pps and 23.2 pps from Q3. Imports fell -0.8% y/y, turning negative again, although by a small magnitude.
China’s exports in November experienced their strongest surge since early 2018: China shipped $268 billion in goods, more than 21% more than in the same month last year, pushing its trade surplus to a monthly record high of $75.4 billion. China’s global export share increased to over 13% in the second and third quarters from 11% last year, the highest for any quarter. All this happened despite a strong RMB. This can be mostly attributed to China’s good pandemic control, which allowed production to proceed uninterrupted, in comparison to other major economies.

In October, industrial output rose 6.9% y/y, the same rate as in September, and the highest rate this year, up 2.2 pps from October 2019. The national service production index has been rising since the economic opening in February, and achieved positive growth in May. It rose 7.4% y/y in October, up 2 pps from September, and up 0.8 pps from October 2019. Investment rose 1.8% y/y in October, up 1 pps from September.
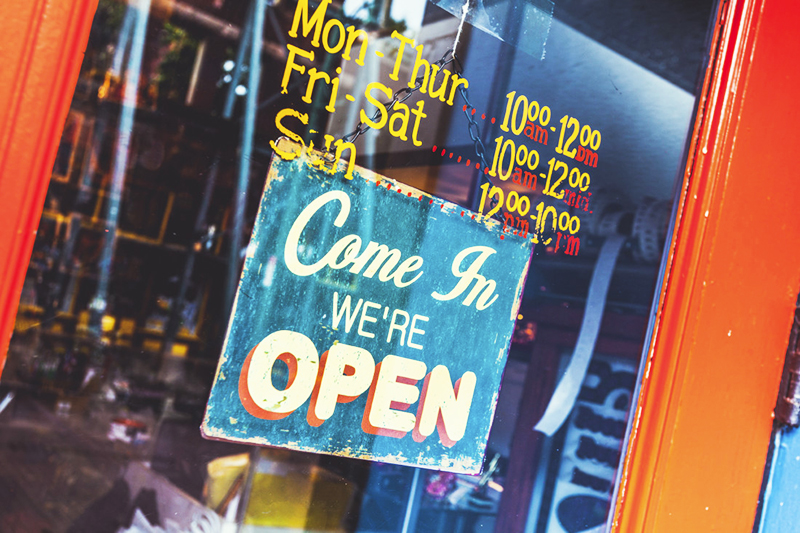
Retail sales of social consumption goods recovered further, and were up 4.3% y/y, and up 3.4 pps from Q3. Their real growth was 4.6% y/y, up 5 pps from Q3.Even the pandemic’s hardest-hit restaurant income has avoided a fall, and was up 0.8% y/y.
Price rises tempered amid monetary expansion. In October, CPI growth fell to only 0.5% y/y, mostly pulled down by significant meat price drops. After adjusting for seasonal factors, CPI fell -0.4% m/m. We expect CPI growth to turn from positive to negative next month, and that this will be a trend for the near future. The ex-factory price index of industrial goods fell -2.1% y/y. PPI fell -2.4% y/y. M1 rose 9.1% y/y, up 1 pps from September, and up 5.8 pps from last October, reaching its highest growth rate since February 2018.
In October, exports rose 7.6% y/y, and imports rose 0.9% y/y. Both of their seasonal adjusted growth rates show upward trends. We expect the appreciation of RMB and economic recovery to bring higher import growth.
On November 15th, 2020, 15 countries — members of the Association of Southeast Asian Nations (ASEAN), and Australia, China, Japan, South Korea and New Zealand signed the Regional Comprehensive Economic Partnership (RCEP), arguably the largest free trade agreement in history. This is the first time China has signed up to a regional multilateral trade pact. This is an example of China’s commitment to the greater openness repeatedly advocated by President Xi Jinping. While the trade deal certainly will boost these countries’ economies in the short term, in the long term it is "a victory of multilateralism and free trade," as Prime Minister Keqiang Li put it, in contrast to U.S. President Donald Trump’s trade policy.

GDP was up 4.9% y/y in Q3, a rise of 1.7 pps from Q2, but still 1.1 pps lower than in Q3 2019. Industrial output was up 5.8% y/y in Q3, up 1.4 pps from Q2, and up 0.8 pps from Q3 2019.
Investment was up 8.8% y/y, up 5 pps from Q2, and up 4.1 pps from Q3 2019, with investment in manufacturing rising fastest, by 9% y/y, up 10 pps from Q2. Retail sales of social consumption goods were up 0.9% y/y, and up 4.8 pps from Q2 -- and their real growth rate was -0.4% y/y.
CPI was up 2.3% y/y in Q3, down 0.4 pps from Q2. In particular, CPI rose only 1.7% y/y in September, an accelerated decrease. Producer prices fell less. The ex-factor price index of industrial goods fell -2.2% y/y, up 0.9 pps from Q2. PPI rose 1.2% m/m. It fell -2.7% y/y, up 1.7 pps from Q2.
The societal financing scale increased 46% y/y, driven by booming government bond issuance. The main financial indicators have stable or slightly increasing growth rates. At the end of Q3, M2 was up 10.9% y/y, down 0.3 pps from June. Household savings rose 13.9% y/y, down 0.4 pps from June. M1 was up 8.1% y/y, up 1.7 pps from June.
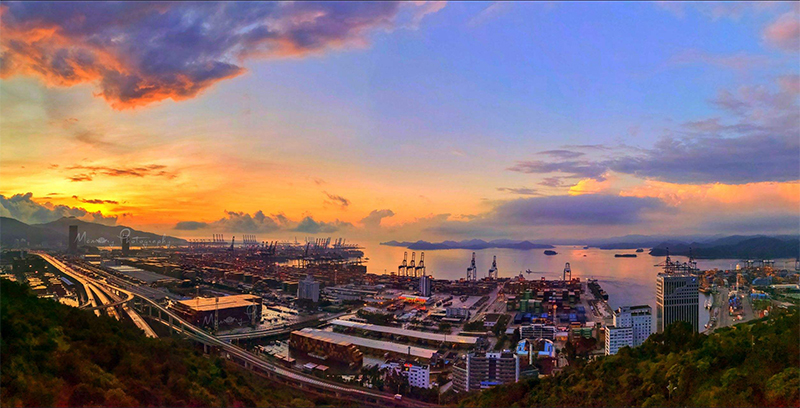
Despite the global pandemic, and the still ongoing U.S.-China trade war, exports are surging, and rose 10.2% y/y, up 5.7 pps from Q2, and up 6.3 pps from Q3 2019. The Chinese share of world exports also climbed, to 20%, from 13.1% in 2019, and 12.8% in 2018. Specifically, exports to the United States rose 19.2% y/y. Imports increased 4.3% y/y, up 10.1 pps from Q2.
The RMB has been appreciating against the dollar since June. On October 26th, the RMB had appreciated 6.7% compared to its value at the end of May. However, the magnitude is still too small to have sizable impacts on trade.
The export surge can be attributed to China’s good pandemic control, and its economy’s high resilience. Based on these two factors, we expect exports will remain in good shape in the near future.
Industrial output was up 5.6% y/y, up 0.8 pps from July, reaching the average growth rate of 2019. We expect growth might slightly exceed the pre-pandemic level for the rest of the year. Investment fell -0.3% y/y January-August, up 1.3 pps from previous months. The driving force is switching from state to private investment, reconfirming the return to pre-pandemic economic recovery.
Consumption was up 0.5% y/y, the first turn to positive growth this year, and up 1.6 pps from July. Exports were up 11.6% y/y, above 10% y/y for two consecutive months. Despite the U.S.-China conflict, exports to the United States grew faster than 20% y/y. Imports fell -0.5% y/y.
CPI growth turned downward in August, and was up 2.4% y/y, falling to the pre-pandemic level. For the next three months, based on the high base numbers of 2019, CPI is expected to fall further. Producer prices continued to rebound. The ex-factory price index of industrial goods fell -2% y/y, and PPI fell -2.5% y/y, up 0.4 and 0.8 pps from July, respectively. But both are still -1.6% and -2.2% y/y lower than in 2019.
The main financial indicators displayed differing patterns in August. M2 was up 10.4% y/y, falling for two consecutive months, and down 0.7 pps from June. M1 rose 8% y/y, up 1.1 pps from July, maintaining its upward trend. The societal financing scale rose 63.1% y/y, mainly driven by large government bond issuance.
The Chinese RMB has strengthened by 2.5% against the dollar in the last four weeks. Cross-border RMB receipts and payments totaled 12.67 trillion yuan, up 36.33% y/y. We expect the RMB will further strengthen in the rest of the year, given the Chinese economy’s much better comeback compared to the United States, the large interest rate differential between the United States and China, and the U.S. dollar flooding into the market. Even though the RMB cannot overtake the dollar in the international market in the near future, the outlook for the RMB is promising.
Industrial output rose 4.8% y/y in July, the same rate as in June, down 1.1 pps from Q4 2019. Investment grew 8.3% y/y, up 2.7 pps from June, and up 2.9 pps from Q4, and is still mainly driven by state investment, with a growth rate of 12.7% y/y. The best performer among fixed asset investments is real estate, with a growth rate of 11.6% y/y in July, up 3.7 pps from Q2.
Consumption is still weak, and was down -1.1% y/y, and up 0.7 pps from June, showing customers’ caution over COVID-19. In July, exports grew 10.4% y/y, up 6.1 pps from June, and up 6.4 pps from H2 2019, possibly due to the halt of overseas production. Imports are fluctuating significantly, and aren’t showing any trend. They rose 1.6% y/y, down 4.6 pps from June.
Producer price growth is trending up. The ex-factory price index of industrial goods rose 0.4% m/m and fell -2.4% y/y. PPI rose 0.9% m/m, and fell -3.3% y/y. Growth of the two indices is down 0.6 and 1.1 pps from June. But we expect future producer prices to at most rebound to their pre-pandemic growth rate levels. CPI rose 2.7% y/y, up 0.2 pps from June. We expect its rise to be temporary.
Major financial indicators have been falling, or flat. M2 rose 10.7% y/y, down 0.4 pps from June. Loans rose 13% y/y, down 0.2 pps from the end of June. M1 grew 6.9% y/y, up just slightly, by 0.4 pps.
On August 14th, a pioneering digital currency initiative initiated by the People’s Bank of China stated that that it would expand the trail program to a number of large cities, with the involvement of the big four state banks. China’s Alibaba has already entered into a “strategic partnership” with the Central Bank over the sovereign digital currency plan. We view digital currency reform as part of the Chinese government’s grand Fintech plan. It will make financial transactions easier, by reducing the intermediary role of commercial banks, directly benefiting small and medium-sized firms.
GDP rose 3.2% y/y in Q2 -- a remarkable performance amid global pandemic. In June, industrial output was up 4.8% y/y, and up 0.4 pps from May, though has still not reached the pre-pandemic level, and was down 1.1 pps from Q4 2019. Investment, mostly driven by state investment, was up 5.6% y/y, up 1.7 pps from June and down 0.2 pps from Q4 2019.
Retail sales of consumption goods fell -1.8% y/y in June, up 1 pps from May. Exports rose 4.1% y/y in June, achieving positive growth for three consecutive months, averaging 4.5% y/y, higher than the growth rate of H2 2019. Imports were up 6.2% y/y, turning positive for the first time.
The ex-factory price index of industrial products fell -3% y/y in June, and PPI fell -4.4% y/y, up 0.7 and 0.6 pps from May, respectively. CPI slightly rebounded, rising 2.5% y/y, up 0.1 pps from May, and increased 0.4% y/y, after removing the seasonal factor.
The main financial indicators were still strong in June. M2 rose 11.1% y/y, the same rate as in May. The still-increasing adjusted M1 rose 7.3% y/y. Savings deposits from non-financial institutions were up 13.2% y/y.
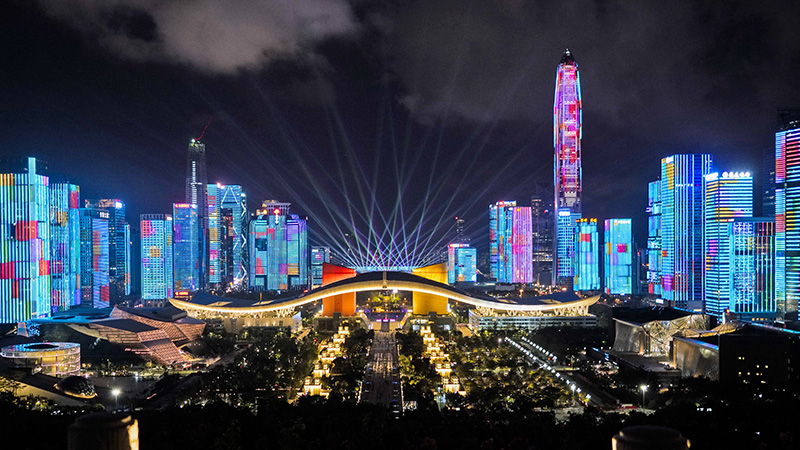
The market has seen a steady increase in money market rates since early May, and the highest 10-year sovereign bond yield in five months. And although People’s Bank of China Governor Yi Gang signaled a fresh liquidity injection two weeks ago, it is taking an unusually long time to be delivered. We expect the strong growth rebound has made monetary loosening exit early. This is partly in order to avoid asset bubbles, in line with the recent housing price surge in major cities like Shenzhen, where housing prices have risen 20% over the past two months, and as seen in the stock market rally.
Industrial output rose 4.4% y/y in May, up 0.5 pps from April, comparable to its pre-pandemic level, and was down just 1.5 pps from Q4 2019. Investment was up 3.9% y/y, and up 3.1 pps from April, down 1.5 pps from Q4. Government investment is the main force lifting overall investment growth.
Consumption demand continued to recover in May. Retail sales of social consumption goods fell 2.8% y/y, up 4.7 pps from April. The global pandemic is not showing any sign of abating, and is heavily impacting trade. In May, exports were up 1.4% y/y, down 6.8 pps from April, while imports plunged 12.7% y/y.
Prices are all falling, creating conditions for future money expansion. The CPI rose 2.4% y/y, down 3 pps from January, mainly driven by food prices. Producer prices fell further. The ex-factory price index of industrial goods decreased 3.7% y/y, and the PPI fell 5% y/y, down 0.6 and 12 pps respectively from April.
Monetary policy is expanding. Major financial indicators all show upward trends. At the end of May, M2 was up 11.1% y/y, and M1 up 6.8% y/y, up 2.3 and 2 pps from the end of February.
On June 12th, Beijing reported its first local coronavirus case, after more than 50 days with zero new locally-transmitted cases. A total of 236 new confirmed cases had been recorded by the writing of this report. Even though such numbers seem insignificant, much evidence shows that COVID-19 might be entering a second phase. This has significantly increased public, and investor, sentiments of uncertainty. Our own survey data shows that 30% of Chinese people believe this virus will persist for a long time. Factoring in the worsening global situation, we are revising downward our GDP growth forecast to 1.4%, which is below other major forecasts, such as that of the IMF.
The National Committee of the Chinese People's Political Consultative Conference (CPPCC) convened the annual two sessions on May 21st. Although for the first time the government did not set an annual growth target - possibly due to so many COVID-19 uncertainties ahead - we expect the implicit growth target is 1.8% for now, given the projected deficit and inflation numbers.
The economy is quickly recovering, as the pandemic has come under control. In April, industrial output growth turned positive, and was up 3.9% y/y, and up 5 pps from March, down only 2 pps from the pre-pandemic level, in Q4 2019. Investment was up 0.8% y/y, and up 10.3 pps from March, mostly driven by expansionary state investment.
Consumption decreased less. Retail sales of consumption goods fell 7.5% y/y, up 8.3 pps from March. Exports were 4% y/y, comparable to the pre-pandemic level. Imports fell 6.1% y/y after seasonal adjustment, down 5.4 pps from Q1. Decreased imports are in line with overall weak domestic demand.
CPI was up 3.3% y/y after seasonal adjustment, down 1 pps from March. We expect CPI to fall further this year, led by large declines in food-related categories.
Monetary policy shows strong support for the economy. M2 was up 11.1% y/y, and M1 increased 5.5% y/y, up 1 and 0.5 pps from March. RMB loans from financial institutions were up 13.1% y/y, up 0.4 pps from the end of March.
China’s housing prices rose at a slightly faster pace in April. According to the National Bureau of Statistics (NBS), average new home prices in 70 major cities rose 0.5% in April from March, a pace not seen since October 2019, and following a 0.1% increase in March. The strong housing market lends support to macroeconomic and financial stability; for example, around 50% of loans in China are directly or indirectly linked to the real estate market. Strong housing investment also shows investor confidence amid domestic pandemic and global economic uncertainties, a key factor furthering the overall recovery.
The Chinese economy was hit hard by the coronavirus in Q1, and GDP fell -6.8% y/y. Because the virus is almost contained in China, economic activities have since March been gradually picking up, and there were clear signs of recovery. Industrial output was down -1.1% y/y, up 12.4 pps from January-February.
Consumption has been hardest hit, largely due to quarantining. Retail sales of social consumption goods fell -19% y/y in Q1, and -15.8% y/y in March, up 4.7 pps from January-February. Trade has so far been largely unaffected. Exports in March were up 2.8% y/y after adjustment, down only 1.4 pps from Q4 2019. Imports were up 2.4% y/y, down 2.8 pps.
Fixed asset investment has been left as the only major factor to keep the economy afloat, because of future weakening overseas demand, and of domestic consumption demand. By March, investment had not recovered to normal levels, falling -9.5% y/y, up 15 pps from January-February.
CPI eventually fell, and was down -0.6% m/m after adjustment, and up 4.3% y/y in March, down 1 pps from January-February. The ex-factory price index of industrial goods fell -1% m/m, and was down -1.5% y/y. PPI fell -1.1% m/m, and was down -1.6% y/y. Major financial indicators are the only ones not negatively impacted. M2 rose 10.1% y/y, and M1 rose 5% y/y, up 1.4 and 0.2 pps respectively from the previous month.
On April 17th, President Xi Jinping chaired a major meeting of the Politburo, China’s highest policy decisionmaking body, which promised to step up the magnitude of policies to achieve the country’s goal of “six stabilities:” stable employment, trade, financial markets, investment, foreign capital and expectations, on the condition that the virus has been effectively controlled. We believe there will be expansionary monetary and fiscal policies, such as interest rate cuts and accelerated infrastructure construction, but not a mass flooding to the market, per the approach of the Fed. Unlike in other major economies, China has been saving for rainy days to make these policies feasible, with its still-sizable gap with a zero interest rate, low central government debt, sizable state-controlled economy meaning non-cyclical unemployment, implicit social security system meaning unemployed migrant workers still possessing agricultural lands, and a high household saving rate.
The coronavirus outbreak in China has had major short-term negative effects on production activities. However, as of March 18th, within China it is largely contained, with zero new cases. The total number of global infection cases outside China has now surpassed the total number of cases in China, and the number is expanding rapidly. Industrial output in China fell -13.5% y/y in January-February, and investment fell -24.5% y/y. But we believe these two major indicators -- especially investment -- will recover soon.
We believe the Chinese economy and finance may be relatively stable, and recover quickly, amid global turmoil. Many economic activities have already recovered to a large extent, thanks to the “Internet plus” program initiated by the state council two years ago, which allows employees to work at home. The Chinese Central Bank has a long way to cut before reaching a zero interest rate, leaving room for further monetary easing, while other major economies’ central banks, including the Fed, now have interest rates near or at zero. The partially state-owned feature of the Chinese economy enables the government to effectively adopt targeted economic policies, such as extending financial favoritism to SMEs.
Negatively impacted by the curfew, with malls and restaurants closed, retail sales of social consumption goods fell -20.5% y/y. In January-February, exports fell -15.9% y/y, down 20 pps from Q4 2019. Imports fell -2.4% y/y, down 7.6 pps from Q4. Even though we believe these major indicators will recover quickly, the worsening coronavirus situation in other countries will hurt trade. We don’t expect recovery to rebound to its pre-coronavirus level soon.
CPI rose significantly in January-February, by 5.3% y/y, and up 0.8 pps from December, due to transportation segmentation organized for the virus curfew. The collapse of major world commodities such as oil also negatively impacted Chinese producer prices. In February, the ex-factory price index of industrial goods fell -0.4% y/y, and PPI fell -0.5% y/y. Both indicators are continuing their declining trends.
The coronavirus, however, has not had the major impact on Chinese financial markets as it has on other production factors. Major financial indicators are mostly stable. At the end of February, M2 was up 8.8% y/y, the same as at the end of 2019, and M1 was up 4.8% y/y, or 0.4 pps.
More...
The coronavirus outbreak that began in late January was one of the most severe exogenous shocks in China’s recent history, especially since it overlapped with the Chinese New Year holiday, which involves the largest population migration in human history. As of February 26th, some 80,428 cases had been confirmed in China.
The Chinese government is using monetary and fiscal policies to boost the economy. On February 2nd, the People’s Bank of China pumped $174 billion into financial markets. As of this writing, the coronavirus has been largely contained, in terms of consistently lower numbers of new cases in China, due to the state’s strong capacity to enforce curfews, and because production is now being resumed. We are not as pessimistic as our peers, such as the Thomson Reuters aggregate survey, which forecasts 4.5% Q1 growth, as we expect to see at least 5% growth. We expect real estate, banking and transportation to be negatively affected, but believe the medical, infrastructure and health areas may be positively affected.
Because of the long Chinese New Year holiday, the statistics bureau, as usual in January, only announced price and financial data. The coronavirus won’t have any real effect on the economy in January, but its impact will show up in February data.
CPI was up 5.4% y/y in January, and up 0.9 ppts from December 2019. We expect the coronavirus to have a larger effect on February data, and to contribute to a higher CPI.
Producer prices were basically stable in January. The ex-factory price of industrial goods was the same as last month, and was up 0.1% y/y, and up 0.6 ppts. PPI fell -0.3% y/y, up 1 ppts from December, and 0.2% m/m.
The coronavirus has not yet shown a significant effect on financial indicators, and the main financial indicators have so far been basically stable. At the end of January, M2 was up 8.4% y/y, and down 0.3 ppts from the end of December. But M1 growth was down 4.4 ppts. Loans from financial institutions were up 12.1% y/y, down 0.2 ppts from December.
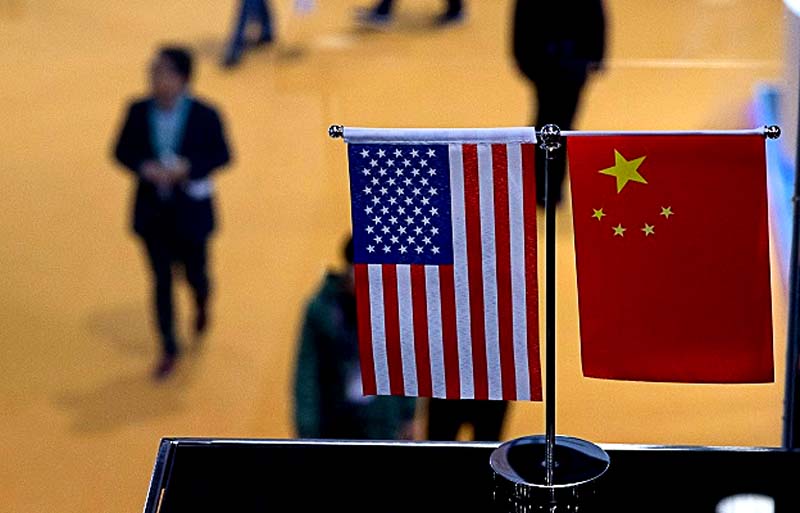
The United States and China on January 16th struck a "phase one" trade deal, at least easing uncertainty over the future of U.S.-China trade relations. Exports raised 5% y/y in 2019, down 2.8 pps from 2018, while imports raised 1.2% y/y, down 11.6 pps.
GDP raised 6.1% y/y last year, down 0.5 pps from 2018. Industrial output raised 5.7% y/y, down 0.5 pps, while investment raised 5.4% y/y, down 0.5 pps.
Fiscal revenue was up 3.8% y/y in January-November 2019, down 2.7 pps from the same period in 2018. Fiscal expenditure was up 7.7% y/y, up 0.9 pps. So the fiscal deficit is rapidly expanding, constraining government’s future fiscal expansion.
CPI was up 4.5% y/y in December, and up 2.6 pps from December 2018. Producer prices have been growing more slowly in 2019. PPI in December fell -1.3% y/y. PPI has been on its steepest decline since July 2016. The official PMI indicated contraction for a sixth straight month. Both reflect weak domestic demand due to growth slowdown. In response, for the first time since 2016, China on November 20th cut the interest rate on its one-year MLF loans by 5 basis points.
The annual Central Economic Work Conference (CEWC) held by top leaders December 10th-12th emphasized “stabilities.” We believe that “around 6%” is the likeliest 2020 growth target. The conference stated that the direction of housing policy in 2020 would be stable. We expect the stabilization policy to ease concerns of potential risks that real estate poses to the macroeconomy. Our confidence is based on China’s strong fundamentals, and strict real estate purchase restrictions.
On January 14th, the U.S. Treasury department dropped China’s designation as a “currency manipulator.” Onshore RMB instantly jumped by 0.2%, its highest level since July. Non-banks also showed net FX inflows of around $6 billion in December. We expect all of these indicators to improve significantly in 2020. Our faith is built upon China’s still-strong fundamentals, relatively peaceful U.S.-China relations in a U.S. election year, and China’s high capital return.
")
")
")
")
")
")
")
")