
Macro Outlook

The economy is showing various signs of weakening. In Q3, GDP was up 6% y/y, down 0.2 pps from Q2, and down 0.5 pps from Q3, 2018. Industrial output was up 5% y/y, down 1 pp from Q3, 2018. Investment was up 4.7% y/y, down 0.8 pps from Q2.
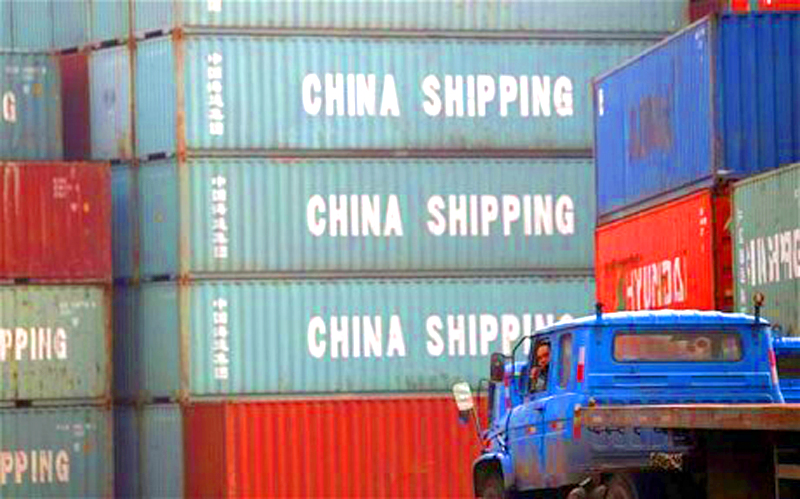
Retail sales of social consumption goods were up 7.6% y/y, down 1 pp from Q2, and down 1.4 pps from Q3, 2018. Sales’ real growth rate was 5.7% y/y, down 0.8 pps from both Q2 and Q3, 2018. Imports fell 2.9% y/y, down 5.2 pps from Q2, and down 21.9 pps from Q3, 2018. Exports rose 3.9% y/y, down 1.8 pps and 6.4 pps from Q2 and Q3, 2018 respectively. The trade declines were mainly caused by the weakening global economy, and trade war with the United States.
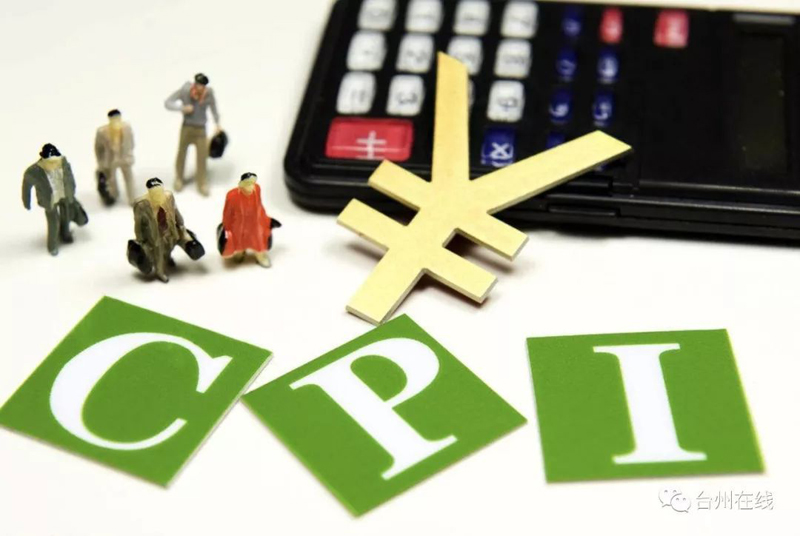
In Q3, CPI rose 2.9% y/y, up 1.1 pps from Q1, continuing its appreciation trend. Producer prices turned to negative growth. The ex-factory price index of industrial goods fell 0.8% y/y, and PPI fell 1.2% y/y, both down 1.3 pps from Q2. Higher CPI raised policymakers’ concern, leading to tightening monetary policy. At the end of September, M2 was up 8.4% y/y, the same as in June. M1 was up 3.4% y/y, down 1 pps from the end of June.
On October 23,the State Council announced 12 detailed measures to better facilitate cross-border trade and investment, including by improving foreign exchange management, and by further streamlining regulatory requirements, with a view to using a more enabling business environment to attract foreign investors. We believe these detailed plans complement the central leadership’s promise early this year of keeping China more open, in contrast to the rise of protectionism in some other countries. The plans are very detailed, and are expected to have an immediate positive impact on trade and foreign investment, and therefore on aggregate economic growth.

Growth is slowing further. In August, industrial output was up 4.4% y/y, down 0.4 pps from July, while investment rose 4.2% y/y, down 1.3 pps from Q2.
Retail sales of social consumption goods were up 7.5% y/y in August, down 1.1 pps from Q2. The indicator’s real growth rate was 5.6% y/y, down 0.9 pps from Q2. Exports were stable, but the import growth rate was plunging. Exports were up 2.6% y/y. Yet recent export growth was rather volatile. The July-August combined growth rate was 5.9% y/y, almost the same as in Q1 and Q2. The much lower export growth to the United States was compensated for by exports to ASEAN countries, and to Taiwan. Imports fell -2.6% y/y, down 4 pps from H1.
CPI was up 2.8% y/y in August, the same rate as in July. Its main components, however, changed significantly, with pork prices skyrocketing due to the sharp reduction of production caused by the previous spread of African swine fever. At the same time, producer prices fell further, and the growth rate turned negative. The ex-factory price index of industrial goods fell -0.8% y/y, and PPI fell -1.3% y/y, down 0.5 and 0.7 pps from July. The major decline in growth rates is mainly due to last year’s high base numbers. We expect this decline to slow by the end of this year. Principal financial indicators are largely stable. At the end of August, M2 was up 8.2% y/y, close to its July rate. M1 was up 3.4% y/y, up 0.3 pps from July.
On September 10th, the State Administration of Foreign Exchange (SAFE) removed the investment quota limitations on two inbound investment schemes: the Qualified Foreign Institutional Investor (QFII) program, and the RMB Qualified Foreign Institutional Investor (RQFII) program. On September 23rd, Standard & Poor's Dow Jones indices included China A-Shares to S&P DJI's Global Benchmark Indices, after the MSCI index’s inclusion. The index company’s response to the inclusion attributed the sole reason to overseas investors’ increased interest in the Chinese market. The bond market also exhibits this internationalization trend this year, such as via the Bloomberg index’s inclusion of the China bond market. Institutional investors with careful analytical tools run contrarily to the negative trade war sentiment. More financial integration will improve China’s capital allocation and market efficiency. This also benefits Chinese firms, by lifting their competitiveness both directly and indirectly, and will increase their internationalization.
Growth slowed in July. Industrial output was up 4.8% y/y, down 0.4 pps from both April and May, falling to a record low rate. The main causes were low investment and consumption, sentiment mostly driven by “trade war.” Investment was up 5.1% y/y, down 0.4 pps from Q2, and down 2.4 pps from Q4 2018, a clear declining trend. Retail sales of consumer goods were up 7.6% y/y in nominal terms, down 1 pps from Q2. Their real growth rate was 5.7% y/y, down 0.8 pps from Q2.
Though trade tensions persist, imports fell more than exports. Imports in dollar terms fell -5.9% y/y, more than in either Q1 or Q2. Exports rose 2.8% y/y, up 1.4 pps and 4.4 pps from Q1 and Q2, respectively. The direct contribution of net exports to GDP was positive, reconfirming our view that trade war “noise” affects China mainly via sentiment.
Producer prices fell. The ex-factory price index of industrial goods fell -0.3% y/y, and -0.2% m/m. This is the first negative growth since September 2016. PPI fell -0.6% y/y in July, and decreased -0.2% m/m, down 0.3 pps from June. We forecast PPI to decline further, but by a moderate magnitude. CPI rose 2.8% y/y, up 0.1 pps from June. CPI is not expected to rise higher. Main financial indicators fell. M2 rose 8.1% y/y, M1 was up 3.1% y/y, down 0.4 and 1.1 pps from June.
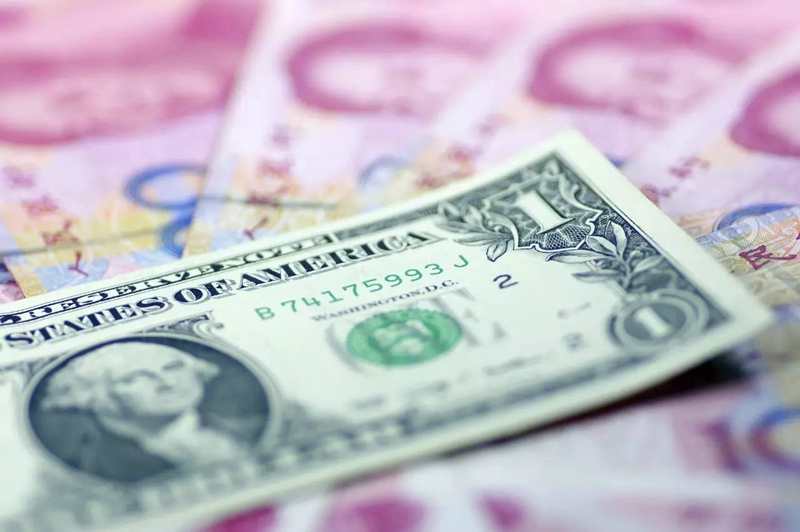
On August 5th, after a Tweet by U.S. President Donald Trump, the U.S. Treasury Department announced it would label China a “currency manipulator.” That day the yuan dropped to below 7 to the dollar, for the first time in over a decade (although the magnitude of the drop was small, as the yuan has hovered around 6.9 for a significant amount of time). Our data shows that the yuan has experienced several similar depreciations in recent years. The “currency manipulator” label seems baseless, according to the United States’ own unilateral standards. But Trump’s accusation is understandable, because Trump is viewed through the prism of huge re-election pressure, and wants a deal before the election. So the Chinese government is simply waiting. Yuan depreciation should be temporary, as it’s driven by the negative sentiment of trade war. In the long term, fundamentals point to a more or less stable yuan.

GDP rose 6.2% y/y in Q2, down 0.2 pps from Q1. Industrial output rose 5.6% y/y, down 0.9 pps, but notably, was up 6.3% y/y in June, obviously higher than in April and May. We judge the unusually high June growth to be a seasonal phenomenon, and unsustainable.
Fixed asset investment was up 5.5% y/y, down 0.8 pps from Q1. In particular, it rose 6.3% y/y, faster than in April and May. Real estate investment rose 10.3% y/y, down 1.5 pps from Q1. This could be an indicator of real estate investment growth turning downward. Retail sales of social consumption goods rose 6.5% y/y in real terms, down 0.4 pps from Q1 -- even though this incorporates the high June number -- due to automobile sales deregulation.
Exports in dollar terms fell -1.6% y/y, down 3 pps from Q1. Export is shifting to the European Union from the United States, because of the ongoing U.S.-China trade war. Exports to the EU rose 9.7% y/y, while exports to the U.S. fell -2.1% y/y, up 1.6 pps from Q1. Imports rose 2.3% y/y, up 1.9 pps from Q1.
CPI stopped appreciating. In June, CPI was up 2.7% y/y, the same rate as in May.
M2 was up 8% y/y at the end of June, down 0.3 pps from May. Although this growth has decreased just a bit, it has reached a new historical low. M1 rose 6.6% y/y, up 0.6 pps from May. Saving deposits rose 5.5% y/y, down 0.2 pps from May, and down 5.2 pps from June 2018.
President Jinping Xi announced, on June 28th at the G20 meeting at Osaka, that China would further open its market, proactively expand imports, continuously improve its business environment for foreign enterprises, and press ahead with negotiations on economic and trade deals. Just two days later, on June 30th, the National Development and Reform Commission and the Ministry of Commerce jointly issued two new “negative lists,” and one “encouraged catalogue,” both indicating improved terms for foreign investment. The number of items on the 2019 national FI [foreign investment] negative list was cut to 40 from 48, and to 37 on the FTZ list. The 2019 FI negative list further opens the services, agriculture, mining, and manufacturing sectors.
We expect China to open up more sectors, especially where the country lacks a strong comparative advantage, such as in services. By contrast, even though U.S. President Donald Trump promised, while meeting with Xi at the G20, that his administration wouldn’t’t levy more tariffs on Chinese goods, Trump’s record of keeping his word is not trustworthy -- to wit, July reports say he does want to add more tariffs. Yet economic globalization is very hard to reverse. Even Trump is realizing that restricting U.S. companies from working with Huawei would hurt U.S. companies’ exports to Huawei. This trade war may last for awhile -- but in the long run, globalization will prevail.

Growth is facing downward pressure. Industrial output rose 5% y/y, down 0.4 pps from April, reaching a new low rate. Investment rose 4.4% y/y, down 1.3 pps from April. The decrease of investment growth rate is mainly affected by state investment because of fiscal deficit pressure. State investment rose 5.6% y/y in May, down 4.2 pps from April. In May, fiscal revenue fell -2.1% y/y, down 7.4 pps from January-April, putting further constraint on state investment. Real estate cooled further.
Retail sales of social consumption goods were up 8.6% y/y in May in nominal terms. The adjusted growth rate was 7.9% y/y, down 0.4 pps from Q1. The adjusted real consumption rose 5.7% y/y, down 1.2 pps from Q1. Trump’s trade war is still ongoing. Even the current negotiation positive sign cannot be taken seriously as he likes to and repeatedly played uncertainty card. Overall, trade was very volatile. In May, the smoothed export growth rate was 5.5% y/y, down 1.2 pps from Q1, down 4 pps from last Q4. The smoothed import growth rate was around 1% y/y, down 8.5 pps from last Q4.
After main financial indicators had large drops in April, they are relatively stable in May. In the end of May, M2 rose 8.5% y/y, comparable to April. M1 rose 3.4% y/y, up 0.5 pps from April.
London-Shanghai connect was initiated on June 17th and foreign companies can list their shares in mainland China for the first time. These will enable firms listed in the UK and mainland China to raise funds on each other’s stock market. This is a continuation of effort in more financial openness, in line with the easing of restrictions on foreign fund manager outflows from China, Beijing on June 12, 2018 lifted the monthly cap of 20 percent on the outflows that investors want to take out China via QFII scheme. More financial openness is consistent with China’s overall policy line in contrast to Trump’s trade protectionism. We expect financial openness will improve China’s capital usage efficiency. We do believe that foreign investors, particularly the professional institutional investors will flow more into China compared to the other way around.
 Almost all major economic indicators are falling. Industrial output was up 5.4% y/y, back to its low January-February level, after its March rise. Fixed asset investment was up 5.7% y/y in April, down 0.6 pps from Q1.
Retail sales of social consumption goods were up 7.2% y/y in nominal terms, reaching their lowest growth rates in recent years, down 1.1 pps from Q1. Real sales growth was up 5.1% y/y, down 1.8 pps from Q1.
CPI was up 2.5% y/y in April, a rise of 0.2 pps from March. Monetary loosening has seemed to stop. In April, the societal financing scale turned to negative growth, after its quick uptick in Q1; this led principal financial indicators to fall. At the end of April, the M2 money supply was up 8.5% y/y, down 0.1 pps from March.
National budget revenue was up 2.8% y/y, down 3.4 pps from Q1, with spending up 15.9% y/y, up 0.9 pps from Q1. Such a large budget deficit is historically very rare, happening only in 1990 and 1995, when it constrained future fiscal expansion.
Exports in April were up 3.1% y/y, down 3.6 pps from Q1, and down 6.4 pps from Q4 2018. Imports were up 10.3% y/y, and up 9.9 pps from Q1. In April, trade with the United States worsened further. Exports to the United States fell -7.9% y/y, down 4.2 pps from Q1, while imports fell -21.4% y/y, down 1.9 pps.
The U.S.-China trade war is escalating. On May 5th, U.S. President Donald Trump said previous U.S. tariffs of 10% levied against $200 billion worth of Chinese goods would be raised to 25% on May 10th. China announced it would raise tariffs on $60 billion worth of U.S. goods. On May 21st, following pressure from the U.S. government, Google suspended Huawei's access to Google services and apps, to reduce Huawei’s competitiveness.
Trade war is hurting both China and the United States, and global trade as well. The uncertainty generated by trade war has reduced investment in China – or has at least made many investors delay their projects, since last year. Negative market sentiment can be seen from the major stock market drop. This also hurts technological advancement, although it’s hard to hinder technology spillover amid today’s fast and transparent information flow. On April 2nd, the WTO trimmed its 2019 global trade growth forecast to 2.6%, from 3.7%. Countries on the global supply chain are suffering. Singapore, for example, which relies heavily upon the global supply chain, saw its economic growth drop to decade low, of 1.2% GDP growth in Q1. A global slowdown would in turn hurt both China and the United States.
 The Chinese economy began to rebound in Q1, with GDP up 6.4% y/y, flat on Q4 2018. Industrial output was up 6.5% y/y, up 0.8 pps from Q4. Then in March, GDP rose a powerful 8.5% y/y, up 1.4 pps from Q4, to its fastest growth rate since August 2014.
Investment, up 6.3% y/y, showed no clear trend. State investment was up 6.7% y/y, up 8.3 pps from Q3 2018, signaling government’s intention to keep supporting the economy.
Retail sales of consumption goods was up 8.3% y/y in Q1 in nominal terms, flat on Q4. Sales’ real growth rate was 6.9% y/y, up 0.9 pps.
Exports were up 6.7% y/y, down 1.8 pps, while imports rose 0.3% y/y, down 9.2 pps. The net export impact on China’s GDP was positive.
In March, CPI was up 2.3% y/y, and up 0.8 pps from February. The ex-factory price index of industrial goods and PPI rose 0.4% and 0.2% y/y respectively, and the main financial indicators also rose. At the end of March, M2 was up 8.6% y/y, up 0.5 pps from the end of 2018. In a strong recovery, M1 rose 4.6% y/y, up 3.1 pps from the end of 2018. Savings deposits from non-financial institutions were up 7% y/y, up 3.2 pps from 2018.
The second Belt and Road Initiative Forum hosted 37 countries in Beijing during the week of April 24th, with eight more countries participating since the last forum two years ago, including two new EU countries, Austria and Portugal. The initiative and dialogue forum will enhance global economic cooperation. The recent nexus of economic and geopolitical friction, such as the Huawei conflict with the Canadian government, requires negotiations. In our view, the Chinese government not only uses policy instruments to smooth over domestic economic cycles, but also tries to calm the international business cycle, adding strategic international investment. This can be seen from the relatively stable exchange rates, in external accounts, and in FDI and ODI.
 Prime Minister Keqiang Li announced during his annual address to the People’s Congress of Beijing on March 5th that China’s growth target for 2019 would be in the 6% to 6.5% range. Another key takeaway is a significant 3 pps cut in value-added tax rate for manufacturers, to 13%.
Industrial output was up 5.3% y/y in January-February, a record low rise, and down 0.4 pps from Q4 2018. The slowdown was mainly caused by weakening auto industry output, and a plunge in exports. Fixed asset investment was up 6.1% y/y, down 1.4 pps from Q4, but 1.6 pps higher than the lowest rate seen in 2018, in Q3. It’s hard to conclude a clear trend for investment growth. Retail sales of consumer goods were up 7.1% y/y in real terms, up 1.1 pps from Q4. Trade dipped further. Exports were up only 0.1% y/y, down 10.2 pps from the fastest-growing rate, in Q3. Imports were up 1.5% y/y, down 17.5 pps from Q3, and have been sharply declining since November.
CPI rose 1.6% y/y in February, down 0.7 pps from its highest growth rate, in Q3 2018. We expect the CPI to fall further. For producer prices, the ex-factory price index of industrial products and PPI were up 0.1% and -0.1% y/y, down 4.6 pps and 5.3 pps from its fastest growth rate of 2018. In January-February, M1 rose 2% y/y, up 0.5 from the end of 2018, M2 was up 8% y/y. The total financing scale jumped 25% y/y, in contrast to -14.1% y/y in 2018, possibly to keep future money growth afloat.
On March 15th, at the end of its annual policy conference, Beijing passed a new foreign investment law, in which it promised to give foreign firms treatment equal to domestic firms. Government support will apply equally to foreign firms, and their applications for operating licenses won’t be treated differently from their domestic rivals, Beijing announced. Forced technology transfers will be banned. This policy demonstrates China’s commitment to continue opening, consistent with previous government claims. The equality law will compensate for the negativity from growth slowdown and trade war. We expect FDI, crucially built on investor confidence, might rise, though FDI has already been stable.
 GDP rose 6.6% y/y in 2018, down 0.2 pps from 2017. Growth rates declined each quarter throughout the year, falling from 6.8% y/y in Q1 to 6.4% y/y in Q4. Industrial output was up 6.2% y/y, down 0.4 pps from 2017. The manufacturing sector is the main reason for growth slowdown, and growth there fell from 7% y/y in Q1 to 5.7% y/y in Q4.
Consumption was up 9% y/y in nominal terms, and 7% y/y in real terms, down 1.2 and 1.9 pps from 2017, respectively. In 2018, exports were up 7.1% y/y, down 3.7 pps from 2017. Imports rose 12.9% y/y, down 5.8 pps from 2017. Exports slowed sharply at yearend, rising only 0.2% y/y in December. Imports also slowed, mainly in November and December, up 7.8% y/y and -3.1% y/y respectively. We believe trade war might be a main factor, even though net exports comprise a small share of Chinese GDP.
Producer prices fell in 2018, and are expected to fall further in 2019, in the current tightened monetary policy environment. The ex-factory price of industrial goods rose 3.5% y/y, and PPI rose 4.1% y/y, down 2.8 pps and 4 pps from 2017. CPI instead rose 2.1% y/y, up 0.5 pps from 2017, driven mostly by rising food and gas prices.
At the end of 2018, M1 rose 1.5% y/y, down 10.3 pps from the end of 2017. Savings deposits from non-financial enterprises fell -0.7% y/y, down 11.3 pps from the end of 2017. M2 rose 8.3% y/y, and down 0.4 pps from last year. The shadow banking sector, such as trusted loans, has shrunk, largely due to the effects of financial risk regulation. We believe the Chinese government is mainly using fiscal instruments to boost growth, and that monetary policy won’t change much in 2019.
Investment was up 5.9% y/y in 2018, and up 0.5% y/y in real terms, down 1.3 pps and 0.8 pps, respectively, from 2017. However, in Q4 investment rose, and was up 7.5% y/y, up 3 pps from Q3. In response to December’s annual Central Economic Work Conference plan to increase fiscal support, the State Council approved a 2019 quota for new local government bond issuances of 1.39 trillion yuan, enabling local authorities to start issuing debt from January, ahead of the usual schedule. Moreover, externally, FDI rose 3% in 2018, to $135 billion. Commerce Minister Zhong Shan stated on January 13th that China would reduce restrictions on foreign investment, and address difficulties facing foreign companies investing in China. The investment boost is necessary, as the current slowdown is mainly due to the uncertain global geopolitical environment. We also expect capital allocation efficiency to be enhanced, after the intensive anti-corruption campaign running since 2013.
 Top leaders’ annual Central Economic Work Conference, held from December 19th to 21st, set countering the ongoing growth downturn as its main 2019 goal for the economy. Leaders pledged to cut taxes and fees “on a greater scale;” to increase the issuance of local government bonds by “a relatively large margin;” and to strike a balance between monetary tightening and easing, to ensure “reasonably ample liquidity.” They promised to continue to address the financing difficulties of private and small companies. Such measures are part of official efforts to “strengthen counter-cyclical policy adjustments,” a statement that refers to government support for boosting economic growth, according to statements by the Xinhua News Agency.
Growth slowed further in November. Industrial output was up 5.4% y/y, down 0.6 pps from Q3, and down 0.7 pps from November 2017, to its lowest level since this cycle of economic downturn began. Fixed asset investment was up 7.7% y/y, comparable to October, driven mostly by state investment, with an increase of 6.7% y/y, up 12.5 pps from July.
Consumption and trade dipped further. Retail sales of consumer goods were up 8.1% y/y in nominal terms in November, down 0.9 pps from Q3. Their real growth rate was 5.8% y/y, down 0.7 pps from Q3. Both exports and imports experienced a major growth slowdown. Exports were up 10.2% y/y, down 9.9 pps from October. Imports rose 7.8% y/y, down 18.5 pps from October. We expect trade to deteriorate further, due to the trade war with the United States.
Prices are declining, likely due to the low money supply. In November, CPI rose 2.2% y/y, down 0.3 pps from October. The ex-factory price of industrial goods rose 2.7% y/y, down 0.6 from October. At the end of November, M2 rose 8% y/y, the same rate as in October. M1 rose 1.5% y/y, down 1.2 pps from October, reaching repeated record lows.
China’s auto sales fell -18% y/y in November, and have been plunging since June, marking the first annual negative growth in three decades. As the world’s largest auto market, 29 million cars were purchased in China last year, compared to 19 million in the second largest car market, the United States. Although peer analysts consider the fall in Chinese car sales the result of the 2018 elimination of the auto sale tax rebate policy, we view the main reasons as economic slowdown, a crowding out from the housing boom and strict regulation of the shadow banking sector for consumer loans. But we also view auto sales decline as a short-term phenomenon, as housing prices have already shown declining trends from earlier overshooting.
More...
 Growth was stable but a bit lower in October. Industrial output was up 5.9% y/y, up only by 0.1 pps from September. Investment rose 8% y/y, having been rising for three consecutive months, and up 5 pps compared to the lowest rate in July. State investment is accelerated to counteract other negative growth factors.
Retail sales of consumer goods were up 8.6% y/y in nominal terms in October, down 0.4 pps from Q3, only up 0.1 pps from the lowest rate in May. Its real growth rate was 6.5% y/y, down 0.9 pps from Q3, reaching the lowest rate since this cycle of economic slowdown.
Despite of trade war, trade is booming. Exports rose 20.1% y/y, up 9.8 pps from Q3. Imports rose 26.3% y/y, up 7.3 pps from Q3. Trade surplus to the US widened in particular, possibly thanks to the strong dollar, reached 218.1 billion yuan in October, and rose 23.9% y/y.
Prices growth is expected to go downwards with the current non-loosened monetary policy. In October, CPI rose 2.5% y/y, same rate as September. The ex-factory price index of industrial outputs and PPI grew 3.3% and 4% y/y, down 0.3 and 0.2 pps from September respectively.
In the end of October, M2 was up 8% y/y, down 0.3 pps from September. M1 rose 2.7% y/y, down 1.3 pps from September, reaching new low since this downturn cycle, having already been lower than the bottom in last cycle in March 2015. However, the trend is still fast declining. Central bank has the incentive not to lower interest rate to keep RMB afloat.
Infrastructure investment growth rate had its first rise in October this year. In particular, it rose 3.7% y/y, up 0.4 pps from September. This has been shown in recent intensive announcements for new openings and approvals of mega-projects, such as speed railway. Chinese government’s relative low public debt at 47.6% of GDP with its international peers made such investment possible and sustainable for a while. Stronger monitoring by central government over local government spending may improve infrastructure investment efficiency. The low central government debt also makes tax reduction possible, as it has announced on November 1st to reduce value added tax rate for private firms, SMEs, and high-tech companies. Both infrastructure investment and tax cut will generate future growth, and the former will have a boost to the economy even in a short term.
 Growth slowed in Q3, though it remained in a stable zone, with GDP expanding 6.5% y/y, down 0.3 pps from H1. Though the most uncertain factor is the U.S.-China trade war, trade is booming: in Q3, exports were up 10.3% y/y, and up 7 pps from Q2. Imports were up 19% y/y, up 8 pps from Q2. Trade also comprises a very small share of Chinese GDP, and we are still optimistic that H2 growth will be stable.
Industrial output was up 6% y/y in Q3, down 0.7 pps from H1. Moreover, it rose 5.8% y/y in September, close to a historical low. Fixed asset investment was up 4.5% y/y, down 0.7 pps from Q2, and down -0.9% y/y in real terms. However, for different months, investment growth rates show promising increasing patterns. In particular, investment rose 4.1% y/y in August, up 1.1 pps from July. It increased further, by 6% y/y, in September. But it’s still early to forecast that investment growth is turning firmly upward.
Consumption is stable. Retail sales of social consumption goods were up 9% y/y in nominal terms, the same rate as in Q2, and up 6.5% y/y in real terms, down 0.8 pps from Q2.
CPI was up 2.5% y/y in September, after rising for four consecutive months, and up 0.7 pps from May. CPI growth reached a new high since 2014, if we exempt the Spring Festival (New Year) season. The ex-factory price index of industrial products and PPI rose 3.6% and 4.2% y/y, down 0.5 and 0.6 pps from August respectively. However, both CPI and producer prices are expected to have growth limits, due to still-low money supply. In particular, M2 was up 8.2% y/y, basically stable since March. M1 was up 4% y/y, and has not shown signs of rebounding since the big 1.2 pps drop in August.
Despite the trade war between the United States and China, China overtook the United States to become top spot for foreign direct investment globally in H1 2018, with investment up 6% y/y to $70 billion. On October 17th, Bridgewater Associates, the world’s largest hedge fund, registered its first private securities fund in China. Its chief investment officer talks about shifting investment to Asia, and to China in particular. Based on these data, and on anecdotal information, we still have confidence in China. Investors, whether in the financial or real sectors, cannot ignore China’s three key advantages: world-class infrastructure, an educated and still-cheap labor force and most of all, the country’s scale: China is potentially the world’s largest market.
 Growth is still stable amid the uncertainty of trade war. Industrial output was up 6% y/y in July, the same rate as in June, and down 0.6 pps from Q2, still in a stable zone. Investment increased 3% y/y in July, down 2.2 pps from Q2, and down 3.8 pps from July 2017, showing a stark decline. But private investment is in much better shape than state investment. The current investment slowdown might be related to financial deleveraging in both the state enterprise sector and in local governments.
Retail sales of consumer goods were up 6.5% y/y, down 0.8 pps from Q2. The previous housing boom might have crowded out consumption. Despite the U.S.-China trade war, total exports grew 6% y/y, up 2.7 pps from Q2. In particular, exports to the United States were up 6% y/y, up 2.7 pps from Q2, and showed no signs of declining. We expect exports to the United States, at least, won’t decrease too much in future, given the currently weaker yuan. Adjusted imports rose 13.3% y/y, comparable to the rates of recent months.
CPI was up 2.1% y/y in July, up only 0.3 pps from the previous two months. In July, ex-factory production prices were up 4.6% y/y, down 0.1 pps from June. PPI rose 5.2% y/y, up 0.1 pps from June. Tightened monetary policy is on track to return to normal. At the end of July, the M2 money supply was up 8.5% y/y, and up 0.5 pps from June, and is possibly an indicator for an end to monetary policy tightening.
Currency fluctuation and financial risks have been frequently mentioned in the news headlines of late. Yuan depreciation, from 6.3 yuan per dollar at the beginning of this year to 6.87 on August 24th, has attracted a great deal of attention. Meanwhile, there have been reports of incidents of P2P lending bankruptcy, which even caused some investors to protest in their local financial districts. Of course, these are potential risks to the economy and to the financial system in particular. But we believe the risks can be contained by China’s sound fundamentals. Currency depreciation is strongly linked to an overall stronger dollar index, as seen from their strong correlation in our data graph. A Turkish lira-style collapse of the yuan is unlikely. We expect the yuan to fluctuate around 7 against the dollar this year. P2P lending is now under much tighter regulation and, given its relatively small size in the total financial market, is hardly anything likely to cause a systemic crisis.
 GDP was up 6.8% y/y in H1, the same rate as in H2 2017. Industrial output was up 6.7% y/y, up 0.4 pps from H2 2017.
Fixed asset investment was up 6% y/y in H1, down 2.6 pps from H1 2017, and up only 0.3% y/y in real terms, down 3.5 pps from last H1. The major drop of state investment is likely the main cause. Possibly following the government’s deleverage reform to reduce financial risk, state investment rose only 3% y/y, down 9 pps from H1 2017. In H1 2018, retail sales of social consumption goods rose 9.4% y/y in nominal terms, and grew 7.7% y/y in real terms, down 1 and 1.4 pps from H1 2017.
CPI was very stable in H1. It rose 2.2% y/y in Q1, and 1.8% y/y in Q2, the same rate as in Q4 2017. In H1, growth rates for producer prices weakened in February-March but rebounded strongly in May-June. In June, the ex-factory price index of industrial goods rose 4.7% y/y, up 0.6 pps from May, and increased 0.3% m/m. PPI rose 5.1% y/y, up 0.8 pps from May, and increased 0.4% m/m. Tightening monetary policy puts constraints on prices’ future growth.
At the end of June, M2 was up 8% y/y, down 0.3 pps from May, and down 1.4 pps from last June. It reached a historically low new rate. Saving deposits rose 5.5% y/y, down 0.2 pps from May, and down 5.2 pps from last June. Stricter financial regulation is the main cause for cooling financial indicators.
Exports were up 4.9% y/y, down 10.1 pps from H1 2017. Imports were up 11.5% y/y, flat on H1 2017.
From April to June, the Chinese yuan depreciated against the dollar at monthly rates of 0.9%, 1.5%, and 3.5%. The yuan has been depreciating against other currencies at the same time, while the trade war with the United States intensifies. The latest episode was on July 20th, when U.S. President Donald Trump threatened to levy tariffs on every good imported from China, referring to the $505.5 billion in Chinese imports the U.S. took in last year. Trade and U.S.-China relationship uncertainty might explain the yuan’s depreciation. However, yuan depreciation may compensate partially for Chinese exports to the United States during the trade war. Moreover, depreciation can boost Chinese exports to other countries. With net exports taking only a small share of Chinese GDP, we don’t expect the trade war to negatively impact the Chinese economy much.
")
")
")
")
")
")
")
")