
2018 - Macro Outlook
 Top leaders’ annual Central Economic Work Conference, held from December 19th to 21st, set countering the ongoing growth downturn as its main 2019 goal for the economy. Leaders pledged to cut taxes and fees “on a greater scale;” to increase the issuance of local government bonds by “a relatively large margin;” and to strike a balance between monetary tightening and easing, to ensure “reasonably ample liquidity.” They promised to continue to address the financing difficulties of private and small companies. Such measures are part of official efforts to “strengthen counter-cyclical policy adjustments,” a statement that refers to government support for boosting economic growth, according to statements by the Xinhua News Agency.
Growth slowed further in November. Industrial output was up 5.4% y/y, down 0.6 pps from Q3, and down 0.7 pps from November 2017, to its lowest level since this cycle of economic downturn began. Fixed asset investment was up 7.7% y/y, comparable to October, driven mostly by state investment, with an increase of 6.7% y/y, up 12.5 pps from July.
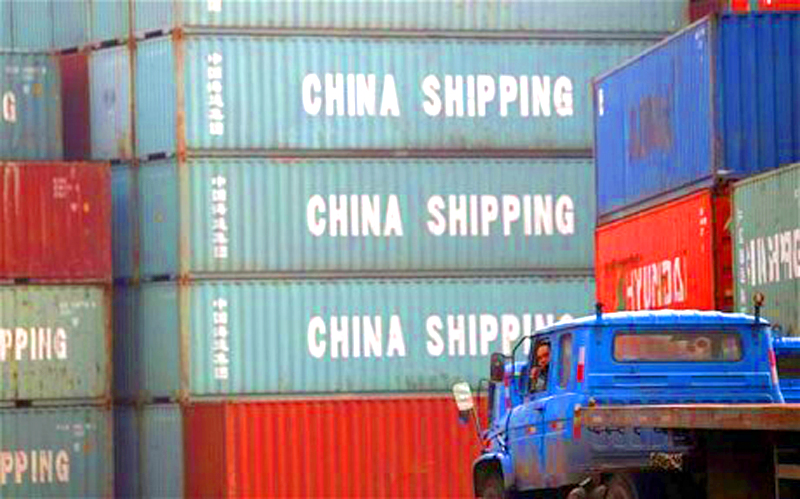
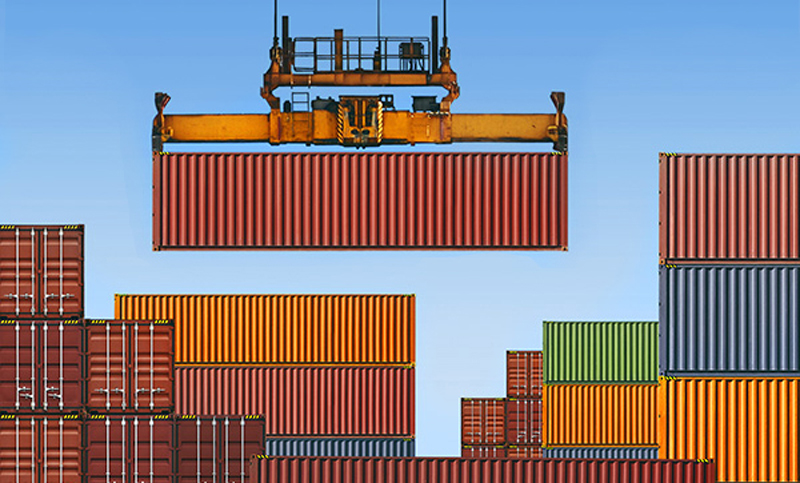
Consumption and trade dipped further. Retail sales of consumer goods were up 8.1% y/y in nominal terms in November, down 0.9 pps from Q3. Their real growth rate was 5.8% y/y, down 0.7 pps from Q3. Both exports and imports experienced a major growth slowdown. Exports were up 10.2% y/y, down 9.9 pps from October. Imports rose 7.8% y/y, down 18.5 pps from October. We expect trade to deteriorate further, due to the trade war with the United States.
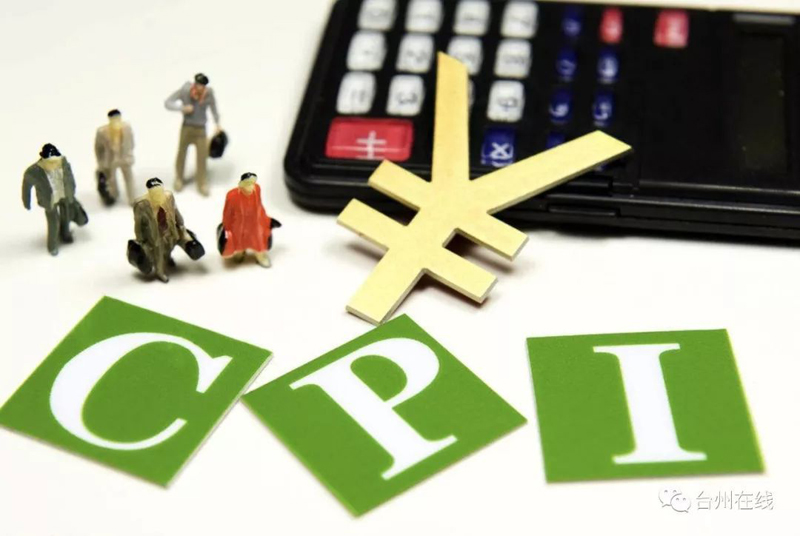
Prices are declining, likely due to the low money supply. In November, CPI rose 2.2% y/y, down 0.3 pps from October. The ex-factory price of industrial goods rose 2.7% y/y, down 0.6 from October. At the end of November, M2 rose 8% y/y, the same rate as in October. M1 rose 1.5% y/y, down 1.2 pps from October, reaching repeated record lows.
China’s auto sales fell -18% y/y in November, and have been plunging since June, marking the first annual negative growth in three decades. As the world’s largest auto market, 29 million cars were purchased in China last year, compared to 19 million in the second largest car market, the United States. Although peer analysts consider the fall in Chinese car sales the result of the 2018 elimination of the auto sale tax rebate policy, we view the main reasons as economic slowdown, a crowding out from the housing boom and strict regulation of the shadow banking sector for consumer loans. But we also view auto sales decline as a short-term phenomenon, as housing prices have already shown declining trends from earlier overshooting.
 Growth was stable but a bit lower in October. Industrial output was up 5.9% y/y, up only by 0.1 pps from September. Investment rose 8% y/y, having been rising for three consecutive months, and up 5 pps compared to the lowest rate in July. State investment is accelerated to counteract other negative growth factors.
Retail sales of consumer goods were up 8.6% y/y in nominal terms in October, down 0.4 pps from Q3, only up 0.1 pps from the lowest rate in May. Its real growth rate was 6.5% y/y, down 0.9 pps from Q3, reaching the lowest rate since this cycle of economic slowdown.
Despite of trade war, trade is booming. Exports rose 20.1% y/y, up 9.8 pps from Q3. Imports rose 26.3% y/y, up 7.3 pps from Q3. Trade surplus to the US widened in particular, possibly thanks to the strong dollar, reached 218.1 billion yuan in October, and rose 23.9% y/y.
Prices growth is expected to go downwards with the current non-loosened monetary policy. In October, CPI rose 2.5% y/y, same rate as September. The ex-factory price index of industrial outputs and PPI grew 3.3% and 4% y/y, down 0.3 and 0.2 pps from September respectively.
In the end of October, M2 was up 8% y/y, down 0.3 pps from September. M1 rose 2.7% y/y, down 1.3 pps from September, reaching new low since this downturn cycle, having already been lower than the bottom in last cycle in March 2015. However, the trend is still fast declining. Central bank has the incentive not to lower interest rate to keep RMB afloat.
Infrastructure investment growth rate had its first rise in October this year. In particular, it rose 3.7% y/y, up 0.4 pps from September. This has been shown in recent intensive announcements for new openings and approvals of mega-projects, such as speed railway. Chinese government’s relative low public debt at 47.6% of GDP with its international peers made such investment possible and sustainable for a while. Stronger monitoring by central government over local government spending may improve infrastructure investment efficiency. The low central government debt also makes tax reduction possible, as it has announced on November 1st to reduce value added tax rate for private firms, SMEs, and high-tech companies. Both infrastructure investment and tax cut will generate future growth, and the former will have a boost to the economy even in a short term.
 Growth slowed in Q3, though it remained in a stable zone, with GDP expanding 6.5% y/y, down 0.3 pps from H1. Though the most uncertain factor is the U.S.-China trade war, trade is booming: in Q3, exports were up 10.3% y/y, and up 7 pps from Q2. Imports were up 19% y/y, up 8 pps from Q2. Trade also comprises a very small share of Chinese GDP, and we are still optimistic that H2 growth will be stable.
Industrial output was up 6% y/y in Q3, down 0.7 pps from H1. Moreover, it rose 5.8% y/y in September, close to a historical low. Fixed asset investment was up 4.5% y/y, down 0.7 pps from Q2, and down -0.9% y/y in real terms. However, for different months, investment growth rates show promising increasing patterns. In particular, investment rose 4.1% y/y in August, up 1.1 pps from July. It increased further, by 6% y/y, in September. But it’s still early to forecast that investment growth is turning firmly upward.
Consumption is stable. Retail sales of social consumption goods were up 9% y/y in nominal terms, the same rate as in Q2, and up 6.5% y/y in real terms, down 0.8 pps from Q2.
CPI was up 2.5% y/y in September, after rising for four consecutive months, and up 0.7 pps from May. CPI growth reached a new high since 2014, if we exempt the Spring Festival (New Year) season. The ex-factory price index of industrial products and PPI rose 3.6% and 4.2% y/y, down 0.5 and 0.6 pps from August respectively. However, both CPI and producer prices are expected to have growth limits, due to still-low money supply. In particular, M2 was up 8.2% y/y, basically stable since March. M1 was up 4% y/y, and has not shown signs of rebounding since the big 1.2 pps drop in August.
Despite the trade war between the United States and China, China overtook the United States to become top spot for foreign direct investment globally in H1 2018, with investment up 6% y/y to $70 billion. On October 17th, Bridgewater Associates, the world’s largest hedge fund, registered its first private securities fund in China. Its chief investment officer talks about shifting investment to Asia, and to China in particular. Based on these data, and on anecdotal information, we still have confidence in China. Investors, whether in the financial or real sectors, cannot ignore China’s three key advantages: world-class infrastructure, an educated and still-cheap labor force and most of all, the country’s scale: China is potentially the world’s largest market.
 Growth is still stable amid the uncertainty of trade war. Industrial output was up 6% y/y in July, the same rate as in June, and down 0.6 pps from Q2, still in a stable zone. Investment increased 3% y/y in July, down 2.2 pps from Q2, and down 3.8 pps from July 2017, showing a stark decline. But private investment is in much better shape than state investment. The current investment slowdown might be related to financial deleveraging in both the state enterprise sector and in local governments.
Retail sales of consumer goods were up 6.5% y/y, down 0.8 pps from Q2. The previous housing boom might have crowded out consumption. Despite the U.S.-China trade war, total exports grew 6% y/y, up 2.7 pps from Q2. In particular, exports to the United States were up 6% y/y, up 2.7 pps from Q2, and showed no signs of declining. We expect exports to the United States, at least, won’t decrease too much in future, given the currently weaker yuan. Adjusted imports rose 13.3% y/y, comparable to the rates of recent months.
CPI was up 2.1% y/y in July, up only 0.3 pps from the previous two months. In July, ex-factory production prices were up 4.6% y/y, down 0.1 pps from June. PPI rose 5.2% y/y, up 0.1 pps from June. Tightened monetary policy is on track to return to normal. At the end of July, the M2 money supply was up 8.5% y/y, and up 0.5 pps from June, and is possibly an indicator for an end to monetary policy tightening.
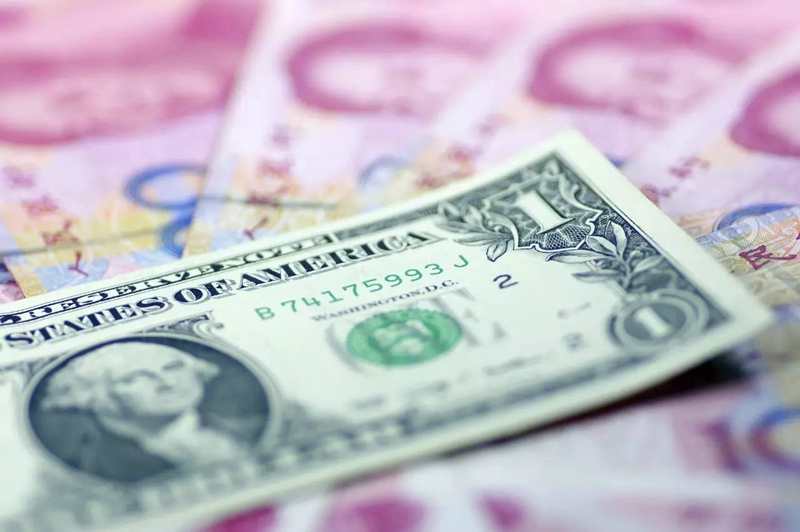
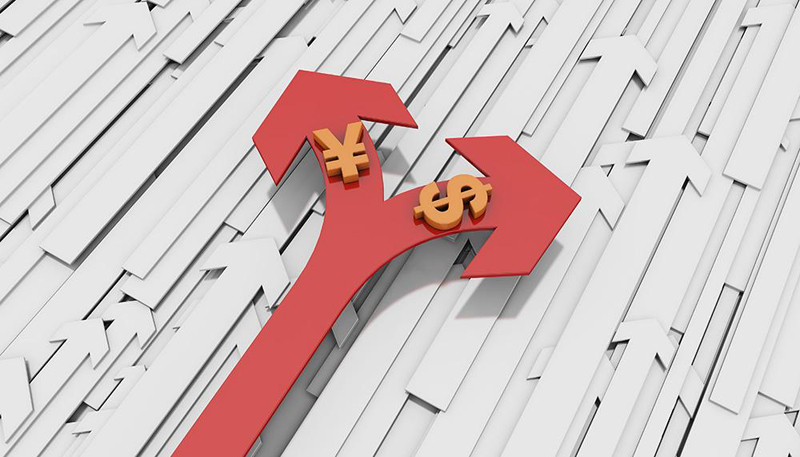
Currency fluctuation and financial risks have been frequently mentioned in the news headlines of late. Yuan depreciation, from 6.3 yuan per dollar at the beginning of this year to 6.87 on August 24th, has attracted a great deal of attention. Meanwhile, there have been reports of incidents of P2P lending bankruptcy, which even caused some investors to protest in their local financial districts. Of course, these are potential risks to the economy and to the financial system in particular. But we believe the risks can be contained by China’s sound fundamentals. Currency depreciation is strongly linked to an overall stronger dollar index, as seen from their strong correlation in our data graph. A Turkish lira-style collapse of the yuan is unlikely. We expect the yuan to fluctuate around 7 against the dollar this year. P2P lending is now under much tighter regulation and, given its relatively small size in the total financial market, is hardly anything likely to cause a systemic crisis.
 GDP was up 6.8% y/y in H1, the same rate as in H2 2017. Industrial output was up 6.7% y/y, up 0.4 pps from H2 2017.
Fixed asset investment was up 6% y/y in H1, down 2.6 pps from H1 2017, and up only 0.3% y/y in real terms, down 3.5 pps from last H1. The major drop of state investment is likely the main cause. Possibly following the government’s deleverage reform to reduce financial risk, state investment rose only 3% y/y, down 9 pps from H1 2017. In H1 2018, retail sales of social consumption goods rose 9.4% y/y in nominal terms, and grew 7.7% y/y in real terms, down 1 and 1.4 pps from H1 2017.
CPI was very stable in H1. It rose 2.2% y/y in Q1, and 1.8% y/y in Q2, the same rate as in Q4 2017. In H1, growth rates for producer prices weakened in February-March but rebounded strongly in May-June. In June, the ex-factory price index of industrial goods rose 4.7% y/y, up 0.6 pps from May, and increased 0.3% m/m. PPI rose 5.1% y/y, up 0.8 pps from May, and increased 0.4% m/m. Tightening monetary policy puts constraints on prices’ future growth.
At the end of June, M2 was up 8% y/y, down 0.3 pps from May, and down 1.4 pps from last June. It reached a historically low new rate. Saving deposits rose 5.5% y/y, down 0.2 pps from May, and down 5.2 pps from last June. Stricter financial regulation is the main cause for cooling financial indicators.
Exports were up 4.9% y/y, down 10.1 pps from H1 2017. Imports were up 11.5% y/y, flat on H1 2017.
From April to June, the Chinese yuan depreciated against the dollar at monthly rates of 0.9%, 1.5%, and 3.5%. The yuan has been depreciating against other currencies at the same time, while the trade war with the United States intensifies. The latest episode was on July 20th, when U.S. President Donald Trump threatened to levy tariffs on every good imported from China, referring to the $505.5 billion in Chinese imports the U.S. took in last year. Trade and U.S.-China relationship uncertainty might explain the yuan’s depreciation. However, yuan depreciation may compensate partially for Chinese exports to the United States during the trade war. Moreover, depreciation can boost Chinese exports to other countries. With net exports taking only a small share of Chinese GDP, we don’t expect the trade war to negatively impact the Chinese economy much.
 Growth is facing downward pressure. Chinese fixed asset investment, a key growth driver, was up by a new low of just 3.9% y/y in May, and down 3.6 pps from Q1, as U.S. President Donald Trump announced that the United States would apply tariffs of 25% to roughly $50 billion worth of Chinese goods. A trade dispute between the world’s two largest economies will surely add uncertainty to the global market, and to Chinese domestic investment and economic growth as well. It’s still too early to measure the size of this impact, but we’d like to argue that trade’s direct effect on Chinese growth won’t be large, given trade’s small net share in Chinese GDP.
Value added for major industrial firms was up 6.8% y/y in May, slightly lower than in April. Retail sales of social consumption goods were up 8.5% y/y in nominal terms, and 6.9% y/y in real terms, the lowest rates since 1999. Imports grew much faster than exports. Exports rose 3.2% y/y, still on a declining trend since June 2017, and down 4 pps from Q1. Imports were up 15.6% y/y, and up 3.7 pps from Q1.
But M1 rose 6% y/y at the end of May, a new low, down 1.2 pps from April. This downward cycle of M1 growth started in August 2016, and has been continuing for 22 months, a situation mostly attributed to a new financial regulation to curb systemic risk. CPI growth, up 1.8% y/y, was flat. Producer prices rebounded powerfully, after three months of decline. The ex-factory price index of industrial goods was up 4.1% y/y, up 0.7 pps from April. PPI rose 4.3% y/y, up 0.6 pps from April. However, we expect producer price appreciation won’t be sustainable amid tightening monetary policy.
China’s integration with the rest of world shows no sign of slowing, the U.S.-China trade war notwithstanding. Chinese domestic investors made $47.89 billion in non-financial ODI in 2,987 overseas companies in 149 countries and regions between January and May, rising a robust 38.5% y/y. The rare decline of ODI growth in 2017 is mainly due to government regulations to curb financial risks, and financial extension of the anti-corruption campaign. The Belt and Road Initiative mainly invests in infrastructure. The economic return should be long term, and should also benefit China from a geopolitical strategy perspective. Countries disappointed in Trump’s retreat from globalization may also become more welcoming to China.
 Growth data was mixed in April. The value added for industrial firms was up 7% y/y, up 0.2 pps from Q1 and up 0.8 pps from Q4 2017. Fixed asset investment was up 6.1% y/y, down 1.4 pps from Q1, although still higher than in Q3 2017. Specifically, private investment was up 7.5% y/y, down 1.4 pps from Q1, and state investment was up 5.4% y/y, down 1.7 pps from Q1.
Retail sales of social consumption goods climbed 9.4% y/y in April in nominal terms, down 0.4 pps from Q1. The real growth rate rose 7.9% y/y, down 0.2 pps from Q1. In April, exports were up 12.9% y/y, 1.2 pps lower than in Q1, though still high. The seasonally adjusted import growth rate is around 17% y/y. The fact that import growth exceeded export growth will help reduce global imbalance and sustain growth.
CPI was up 1.8% y/y in April, after falling for two consecutive months. We expect CPI this year will be like the trend in 2014, growing at stable rates. The fluctuation interval is between 1% and 2.5% y/y. Producer prices continue their slower growth trend, after growing powerfully for almost two years. The ex-factory price of industrial goods was up 3.4% y/y, and down -0.2% m/m. PPI rose 3.7% y/y, and fell -0.3% m/m.
Monetary policy is still tightening. At the end of April, M1 was up 7.2% y/y, and up just slightly -- by 0.1 pps -- from March. RMB savings deposits from non-financial enterprises were up 6.1% y/y, and up 0.8 pps from March. Both indices were mainly affected by large reductions last month, rather than signaling monetary policy loosening.
After high-level trade talks in Washington, the United States and China announced on May 21st that they would put their tariff increase threats on hold. This is very much consistent with our forecast last month that the trade war would be short-lived. We expect China to import more from the United States, as in the past, mostly in agriculture, high tech and services. This will reduce uncertainties in the global economy, and may boost investor confidence, as signaled the day after the announcement, when the S&P 500 rose 0.8%. Although the agreement would reduce China’s net exports, the impact on GDP would be negligible, as the trade share of GDP is much smaller than it once was. Use of imported high tech as capital goods in industries will certainly boost Chinese firms’ productivity. We view cooperation between China and the United States as a win-win solution for both countries, and for the world.
 Chinese economic growth was stable in Q1. GDP was up 6.8% y/y, flat on Q4. Industrial output was up 6.8% y/y, and up 0.6 pps from Q4.
Investment rose 7.5% y/y in Q1, up 1.7 pps from the lowest growth rate of 2017. However, the price-adjusted investment growth rate rose only 1.2% y/y. Assuredly, private investment recovered strongly, and rose 8.9% y/y, up 4.7 pps from Q3, reaching its highest rate since 2016. In Q1, real estate investment grew 10.4% y/y, up 6.3 pps from Q4 - its highest growth rate since 2015.
Retail sales of consumption goods were up 9.8% y/y in Q1 in nominal terms, and 8.1% y/y in real terms. Although both figures were only slightly lower than in Q4, these were among lowest growth rates since 2004.
Prices are declining, amid tightening monetary policy. CPI was up 2.1% y/y in March, down 0.1 pps from January-February. In March, producer price growth continued to fall rapidly. The ex-factory price index of industrial output was up 3.1% y/y, down 0.6 pps from February. This is the fifth consecutive decline. PPI was up 3.7% y/y, down 0.7 pps from February. Monetary policy is still tightening, and financial regulation is stricter, intended to reduce financial risk. In March, M1 rose 7.1% y/y, down 4.7 pps from the end of 2017, and down 11.7 pps from last March.
Though exports were up 14.1% y/y in Q1, up 4.9 pps from Q4 and up 8.5 pps from Q3, and imports were up 18.9% y/y, China and the United States are in a trade war. On March 22nd, U.S. President Donald J. Trump signed a memorandum to apply tariffs of $50 billion on Chinese goods. In a quick response, China raised its tariffs on 128 U.S. products, with implementation beginning on April 2nd. Both countries indicated that they plan to hike tariffs on the other’s exports far more.
The U.S.-China trade war may be short-lived. We believe that the United States has more to lose. The exit of U.S. firms from the Chinese outsourcing labor market will give its competitors a greater advantage in improving their balance sheets, and consequently in profit, R&D expenditure and TFP -- and in the end, more wins. Take the U.S.’s Apple vs. South Korea’s Samsung, for example. China’s large state capacity, as seen from the state sector’s sizable share of the economy and better government budget situation, will make growth both feasible and stable, as greater state capacity means better macro management ability. Too, the share of exports in Chinese GDP growth has declined steadily over the years.
 Prime Minister Keqiang Li announced during a March 5th address to the People’s Congress of Beijing that China’s growth target for 2018 would be about 6.5%, the same as in 2017, when growth reached 6.9%. The yuan will be “basically stable” at a reasonable level, Li also predicted. More local government debt will be cut, but not at the cost of infrastructure. Moreover, reducing financial risk will be key for the regulatory agency, an emphasis further confirmed by new Central Bank governor Gang Yi, who took office after Xiaochuan Zhou’s 13 years of service.
Only three days after the People’s Congress ended, U.S. President Donald Trump announced the plan to impose tariffs on $60 billion China’s exports to the United States. Such unilateral protectionist measures really pushed the Chinese economy, China-U.S. economic relations and the whole global trade system into great uncertainty, at least for the near future! Exports in January-February were up 24.4% y/y, a significant 15.2 pps rise from Q4 2017. Though export growth is generally rising, the current surge is still exceptional, and likely to be a short-term phenomenon. Imports were up 21.7% y/y, and the adjusted growth rate a still-flat rise of about 14.7% y/y.
Industrial output was up 7.2% y/y in January-February, up 1.1 pps from Q4, to a new post-2015 high. Fixed asset investment was up 7.9% y/y, up 1.5 pps from Q4, and up 2.1 pps from its nadir in Q3. Retail sales of consumer goods were up 9.7% y/y in nominal terms, down 0.2 pps from Q4, and up 7.9% y/y after considering the price factor, and down 0.5 pps from Q4. In February, the ex-factory price index of industrial products was up 3.7% y/y, a constantly falling growth rate, down 2.2 pps from Q4. PPI has demonstrated a similar trend. We expect producer price growth to fall further, given tightening monetary policy. CPI continued its slower rise, up 2.2% y/y in January-February, and up 0.4 pps from Q4. We expect CPI to rise by around 2.5% this year. M1 was up 11.7% y/y, and the adjusted rate is around 10% y/y, still falling from August 2016. M2 was up 8.7% y/y, less than almost every month in 2017.
Chinese politics has received much media attention this month. The first issue was the constitutional change of presidential term limits, with the elimination the two-term limit making it possible for President Jinping Xi to remain in his post after his second term. The second issue was the creation of new top positions and agencies, such as the National Supervision Commission, at the same political rank as the Justice Department, to battle corruption. We see policy continuity from this change of political arrangement, with deepening reform. We view centralization as favorable for breaking regional and uncoordinated barriers, such as pollution. And the continuing anti-corruption campaign will benefit the economy. At least for the short and medium term, we view China’s political arrangement as favorable to its growth.
 The ex-factory price index of industrial products was up 4.3% y/y in January, down 1.6 pps from Q4 2017. PPI was up 5.2% y/y, down 1.9 pps. Given tightening monetary policy, we expect producer prices will continue their downward trend in 2018. Due to the Spring Festival – the Chinese New Year -- many statistics are still unavailable. We can only analyze data from imports and exports, and on financial conditions and price levels. CPI was up 1.5% y/y in January or 2% y/y after correcting for the Spring Festival factor, slightly higher than in Q4. Similarly, with tightening monetary policy, a CPI increase at this high rate of 2% is not sustainable. Trade growth is within normal range, after adjusting for the holiday factor. Imports were up 36.9% y/y. This very high growth rate was instantly adjusted for the holiday effect to 13.2% y/y, in a normal range instead. Exports were up 9.7% y/y after the holiday adjustment, up 0.5 pps from last December. The M1 money supply was up 15% y/y at the end of January. Considering that the holidays came late this year, the adjusted M1 growth rate was even lower than in December. The general declining trend has not changed. M2 money supply was up 8.6% y/y, lower than almost all months in 2017. RMB loans from financial institutions were up 13.2% y/y. Savings deposits from non-financial enterprises were up 12.1% y/y. These two relatively high growth rates were the main ones affected by the holiday. In January, the societal financing scale fell -17.2% y/y. In particular, the increase outside of RMB loans fell -74% y/y, with a share of only 12.1%. These are immediate outcomes of recent financial regulation tightening, and of de-leveraging efforts.
Although China’s stock market has been hit by the recent huge volatility in the U.S. markets, China’s capital account seems to be shifting into balance. All of China’s external accounts turned to surplus in 2017, including the much worried-over FX reserve, adding $91.5 billion, from a $475.2 billion fall in 2016. The outside market is volatile, but Chinese growth is strong. The Chinese government is taking major steps to tackle any potential financial market disruption factors, as analyzed in detail in our recent reports. Based on these three factors, we expect in 2018 that the RMB-U.S. dollar exchange rate will be basically stable, that the capital account surplus will rise, and that foreign reserves will grow.
More...
 Growth was robust and stable throughout 2017, even as fixed asset investment and consumption kept weakening. Exports rose, after two years of decline. Producer prices were elevated, while CPI showed little volatility. Monetary policy returned to moderately neutral levels, from its previous tight condition, and the money supply plunged.
GDP was up 6.9% for the year, and up 0.2 pps from 2016. Growth was consistent in quarterly terms, at 6.9% y/y in Q1 and Q2, and 6.8% y/y in Q3 and Q4. Value added for primary industry rose 3.9% in 2017, up 0.2 pps from 2016; manufacturing industry was up 6.1% y/y, flat on 2016; and services rose 8% y/y, up 0.2 pps. Industrial output rose 6.6% y/y, up 0.6 pps, though growth has been slowing. Fixed asset investment was up 7.2%, down 0.9 pps from 2016. After removing the price factor, investment was up 1.3% y/y, down 7.4 pps from 2016. Real estate sales turned from heating to cooling, the 19.5% y/y rise in Q1 falling to just 2.5% y/y by Q4, adding another factor in investment drop. Exports, conversely, picked up, rising 7.9% y/y, up 15.6 pps from 2016. Producer prices continued last year’s appreciation trend. The ex-factory price of industrial goods rose 6.3% y/y, and PPI rose 8.1% y/y. CPI rose 1.6% y/y, down 0.4 pps from 2016. The main financial indicators experienced major decreases. By the end of 2017, M2 rose 8.2% y/y, down 3.1 pps from 2016; M1 rose 11.8% y/y, down 9.6 pps from 2016.
This year begins with intensive financial regulations. On January 5th and 6th, China’s Bank Regulatory Commission issued three documents aimed at strengthening commercial bank regulation, related to trusted loans, bank equity and the too–big-to-fail mentality. These rules are responses to the central government’s main goal, set at the end of 2017 for 2018, to contain financial risks. On December 20th, the central government listed alleviating financial risk as one of the top three tasks facing central government. This again is a continuation of the central committee meeting about financial risk in mid-2017, led by President Xi Jinping.
We view the potential financial risks in China as containable, as the regulators have recognized the problems, and are determined to take serious steps to deal with them. Shadow banking as part of financial liberalization requires prudential regulation. The Chinese government has the capability, and the advantage of designing regulation by absorbing the lessons of U.S. 2008 subprime mortgage crisis.
")
")
")
")
")
")
")
")