
Macro Outlook
 Growth is facing downward pressure. Chinese fixed asset investment, a key growth driver, was up by a new low of just 3.9% y/y in May, and down 3.6 pps from Q1, as U.S. President Donald Trump announced that the United States would apply tariffs of 25% to roughly $50 billion worth of Chinese goods. A trade dispute between the world’s two largest economies will surely add uncertainty to the global market, and to Chinese domestic investment and economic growth as well. It’s still too early to measure the size of this impact, but we’d like to argue that trade’s direct effect on Chinese growth won’t be large, given trade’s small net share in Chinese GDP.
Value added for major industrial firms was up 6.8% y/y in May, slightly lower than in April. Retail sales of social consumption goods were up 8.5% y/y in nominal terms, and 6.9% y/y in real terms, the lowest rates since 1999. Imports grew much faster than exports. Exports rose 3.2% y/y, still on a declining trend since June 2017, and down 4 pps from Q1. Imports were up 15.6% y/y, and up 3.7 pps from Q1.
But M1 rose 6% y/y at the end of May, a new low, down 1.2 pps from April. This downward cycle of M1 growth started in August 2016, and has been continuing for 22 months, a situation mostly attributed to a new financial regulation to curb systemic risk. CPI growth, up 1.8% y/y, was flat. Producer prices rebounded powerfully, after three months of decline. The ex-factory price index of industrial goods was up 4.1% y/y, up 0.7 pps from April. PPI rose 4.3% y/y, up 0.6 pps from April. However, we expect producer price appreciation won’t be sustainable amid tightening monetary policy.
China’s integration with the rest of world shows no sign of slowing, the U.S.-China trade war notwithstanding. Chinese domestic investors made $47.89 billion in non-financial ODI in 2,987 overseas companies in 149 countries and regions between January and May, rising a robust 38.5% y/y. The rare decline of ODI growth in 2017 is mainly due to government regulations to curb financial risks, and financial extension of the anti-corruption campaign. The Belt and Road Initiative mainly invests in infrastructure. The economic return should be long term, and should also benefit China from a geopolitical strategy perspective. Countries disappointed in Trump’s retreat from globalization may also become more welcoming to China.
 Growth data was mixed in April. The value added for industrial firms was up 7% y/y, up 0.2 pps from Q1 and up 0.8 pps from Q4 2017. Fixed asset investment was up 6.1% y/y, down 1.4 pps from Q1, although still higher than in Q3 2017. Specifically, private investment was up 7.5% y/y, down 1.4 pps from Q1, and state investment was up 5.4% y/y, down 1.7 pps from Q1.
Retail sales of social consumption goods climbed 9.4% y/y in April in nominal terms, down 0.4 pps from Q1. The real growth rate rose 7.9% y/y, down 0.2 pps from Q1. In April, exports were up 12.9% y/y, 1.2 pps lower than in Q1, though still high. The seasonally adjusted import growth rate is around 17% y/y. The fact that import growth exceeded export growth will help reduce global imbalance and sustain growth.
CPI was up 1.8% y/y in April, after falling for two consecutive months. We expect CPI this year will be like the trend in 2014, growing at stable rates. The fluctuation interval is between 1% and 2.5% y/y. Producer prices continue their slower growth trend, after growing powerfully for almost two years. The ex-factory price of industrial goods was up 3.4% y/y, and down -0.2% m/m. PPI rose 3.7% y/y, and fell -0.3% m/m.
Monetary policy is still tightening. At the end of April, M1 was up 7.2% y/y, and up just slightly -- by 0.1 pps -- from March. RMB savings deposits from non-financial enterprises were up 6.1% y/y, and up 0.8 pps from March. Both indices were mainly affected by large reductions last month, rather than signaling monetary policy loosening.
After high-level trade talks in Washington, the United States and China announced on May 21st that they would put their tariff increase threats on hold. This is very much consistent with our forecast last month that the trade war would be short-lived. We expect China to import more from the United States, as in the past, mostly in agriculture, high tech and services. This will reduce uncertainties in the global economy, and may boost investor confidence, as signaled the day after the announcement, when the S&P 500 rose 0.8%. Although the agreement would reduce China’s net exports, the impact on GDP would be negligible, as the trade share of GDP is much smaller than it once was. Use of imported high tech as capital goods in industries will certainly boost Chinese firms’ productivity. We view cooperation between China and the United States as a win-win solution for both countries, and for the world.
 Chinese economic growth was stable in Q1. GDP was up 6.8% y/y, flat on Q4. Industrial output was up 6.8% y/y, and up 0.6 pps from Q4.
Investment rose 7.5% y/y in Q1, up 1.7 pps from the lowest growth rate of 2017. However, the price-adjusted investment growth rate rose only 1.2% y/y. Assuredly, private investment recovered strongly, and rose 8.9% y/y, up 4.7 pps from Q3, reaching its highest rate since 2016. In Q1, real estate investment grew 10.4% y/y, up 6.3 pps from Q4 - its highest growth rate since 2015.
Retail sales of consumption goods were up 9.8% y/y in Q1 in nominal terms, and 8.1% y/y in real terms. Although both figures were only slightly lower than in Q4, these were among lowest growth rates since 2004.
Prices are declining, amid tightening monetary policy. CPI was up 2.1% y/y in March, down 0.1 pps from January-February. In March, producer price growth continued to fall rapidly. The ex-factory price index of industrial output was up 3.1% y/y, down 0.6 pps from February. This is the fifth consecutive decline. PPI was up 3.7% y/y, down 0.7 pps from February. Monetary policy is still tightening, and financial regulation is stricter, intended to reduce financial risk. In March, M1 rose 7.1% y/y, down 4.7 pps from the end of 2017, and down 11.7 pps from last March.
Though exports were up 14.1% y/y in Q1, up 4.9 pps from Q4 and up 8.5 pps from Q3, and imports were up 18.9% y/y, China and the United States are in a trade war. On March 22nd, U.S. President Donald J. Trump signed a memorandum to apply tariffs of $50 billion on Chinese goods. In a quick response, China raised its tariffs on 128 U.S. products, with implementation beginning on April 2nd. Both countries indicated that they plan to hike tariffs on the other’s exports far more.
The U.S.-China trade war may be short-lived. We believe that the United States has more to lose. The exit of U.S. firms from the Chinese outsourcing labor market will give its competitors a greater advantage in improving their balance sheets, and consequently in profit, R&D expenditure and TFP -- and in the end, more wins. Take the U.S.’s Apple vs. South Korea’s Samsung, for example. China’s large state capacity, as seen from the state sector’s sizable share of the economy and better government budget situation, will make growth both feasible and stable, as greater state capacity means better macro management ability. Too, the share of exports in Chinese GDP growth has declined steadily over the years.
 Prime Minister Keqiang Li announced during a March 5th address to the People’s Congress of Beijing that China’s growth target for 2018 would be about 6.5%, the same as in 2017, when growth reached 6.9%. The yuan will be “basically stable” at a reasonable level, Li also predicted. More local government debt will be cut, but not at the cost of infrastructure. Moreover, reducing financial risk will be key for the regulatory agency, an emphasis further confirmed by new Central Bank governor Gang Yi, who took office after Xiaochuan Zhou’s 13 years of service.
Only three days after the People’s Congress ended, U.S. President Donald Trump announced the plan to impose tariffs on $60 billion China’s exports to the United States. Such unilateral protectionist measures really pushed the Chinese economy, China-U.S. economic relations and the whole global trade system into great uncertainty, at least for the near future! Exports in January-February were up 24.4% y/y, a significant 15.2 pps rise from Q4 2017. Though export growth is generally rising, the current surge is still exceptional, and likely to be a short-term phenomenon. Imports were up 21.7% y/y, and the adjusted growth rate a still-flat rise of about 14.7% y/y.
Industrial output was up 7.2% y/y in January-February, up 1.1 pps from Q4, to a new post-2015 high. Fixed asset investment was up 7.9% y/y, up 1.5 pps from Q4, and up 2.1 pps from its nadir in Q3. Retail sales of consumer goods were up 9.7% y/y in nominal terms, down 0.2 pps from Q4, and up 7.9% y/y after considering the price factor, and down 0.5 pps from Q4. In February, the ex-factory price index of industrial products was up 3.7% y/y, a constantly falling growth rate, down 2.2 pps from Q4. PPI has demonstrated a similar trend. We expect producer price growth to fall further, given tightening monetary policy. CPI continued its slower rise, up 2.2% y/y in January-February, and up 0.4 pps from Q4. We expect CPI to rise by around 2.5% this year. M1 was up 11.7% y/y, and the adjusted rate is around 10% y/y, still falling from August 2016. M2 was up 8.7% y/y, less than almost every month in 2017.
Chinese politics has received much media attention this month. The first issue was the constitutional change of presidential term limits, with the elimination the two-term limit making it possible for President Jinping Xi to remain in his post after his second term. The second issue was the creation of new top positions and agencies, such as the National Supervision Commission, at the same political rank as the Justice Department, to battle corruption. We see policy continuity from this change of political arrangement, with deepening reform. We view centralization as favorable for breaking regional and uncoordinated barriers, such as pollution. And the continuing anti-corruption campaign will benefit the economy. At least for the short and medium term, we view China’s political arrangement as favorable to its growth.
 The ex-factory price index of industrial products was up 4.3% y/y in January, down 1.6 pps from Q4 2017. PPI was up 5.2% y/y, down 1.9 pps. Given tightening monetary policy, we expect producer prices will continue their downward trend in 2018. Due to the Spring Festival – the Chinese New Year -- many statistics are still unavailable. We can only analyze data from imports and exports, and on financial conditions and price levels. CPI was up 1.5% y/y in January or 2% y/y after correcting for the Spring Festival factor, slightly higher than in Q4. Similarly, with tightening monetary policy, a CPI increase at this high rate of 2% is not sustainable. Trade growth is within normal range, after adjusting for the holiday factor. Imports were up 36.9% y/y. This very high growth rate was instantly adjusted for the holiday effect to 13.2% y/y, in a normal range instead. Exports were up 9.7% y/y after the holiday adjustment, up 0.5 pps from last December. The M1 money supply was up 15% y/y at the end of January. Considering that the holidays came late this year, the adjusted M1 growth rate was even lower than in December. The general declining trend has not changed. M2 money supply was up 8.6% y/y, lower than almost all months in 2017. RMB loans from financial institutions were up 13.2% y/y. Savings deposits from non-financial enterprises were up 12.1% y/y. These two relatively high growth rates were the main ones affected by the holiday. In January, the societal financing scale fell -17.2% y/y. In particular, the increase outside of RMB loans fell -74% y/y, with a share of only 12.1%. These are immediate outcomes of recent financial regulation tightening, and of de-leveraging efforts.
Although China’s stock market has been hit by the recent huge volatility in the U.S. markets, China’s capital account seems to be shifting into balance. All of China’s external accounts turned to surplus in 2017, including the much worried-over FX reserve, adding $91.5 billion, from a $475.2 billion fall in 2016. The outside market is volatile, but Chinese growth is strong. The Chinese government is taking major steps to tackle any potential financial market disruption factors, as analyzed in detail in our recent reports. Based on these three factors, we expect in 2018 that the RMB-U.S. dollar exchange rate will be basically stable, that the capital account surplus will rise, and that foreign reserves will grow.
 Growth was robust and stable throughout 2017, even as fixed asset investment and consumption kept weakening. Exports rose, after two years of decline. Producer prices were elevated, while CPI showed little volatility. Monetary policy returned to moderately neutral levels, from its previous tight condition, and the money supply plunged.
GDP was up 6.9% for the year, and up 0.2 pps from 2016. Growth was consistent in quarterly terms, at 6.9% y/y in Q1 and Q2, and 6.8% y/y in Q3 and Q4. Value added for primary industry rose 3.9% in 2017, up 0.2 pps from 2016; manufacturing industry was up 6.1% y/y, flat on 2016; and services rose 8% y/y, up 0.2 pps. Industrial output rose 6.6% y/y, up 0.6 pps, though growth has been slowing. Fixed asset investment was up 7.2%, down 0.9 pps from 2016. After removing the price factor, investment was up 1.3% y/y, down 7.4 pps from 2016. Real estate sales turned from heating to cooling, the 19.5% y/y rise in Q1 falling to just 2.5% y/y by Q4, adding another factor in investment drop. Exports, conversely, picked up, rising 7.9% y/y, up 15.6 pps from 2016. Producer prices continued last year’s appreciation trend. The ex-factory price of industrial goods rose 6.3% y/y, and PPI rose 8.1% y/y. CPI rose 1.6% y/y, down 0.4 pps from 2016. The main financial indicators experienced major decreases. By the end of 2017, M2 rose 8.2% y/y, down 3.1 pps from 2016; M1 rose 11.8% y/y, down 9.6 pps from 2016.
This year begins with intensive financial regulations. On January 5th and 6th, China’s Bank Regulatory Commission issued three documents aimed at strengthening commercial bank regulation, related to trusted loans, bank equity and the too–big-to-fail mentality. These rules are responses to the central government’s main goal, set at the end of 2017 for 2018, to contain financial risks. On December 20th, the central government listed alleviating financial risk as one of the top three tasks facing central government. This again is a continuation of the central committee meeting about financial risk in mid-2017, led by President Xi Jinping.
We view the potential financial risks in China as containable, as the regulators have recognized the problems, and are determined to take serious steps to deal with them. Shadow banking as part of financial liberalization requires prudential regulation. The Chinese government has the capability, and the advantage of designing regulation by absorbing the lessons of U.S. 2008 subprime mortgage crisis.
 Growth remained stable in November, with industrial output up 6.1% y/y. Fixed asset investment excluding agriculture was up 6.3% y/y, up 0.5 pps from October, and up 2.4 pps from its August nadir. However, the current investment growth rate is still lower than investment goods’ price growth rate, indicating that real investment growth is still negative, by -0.2% y/y.
National fiscal revenue fell -1.4% y/y, turning negative for the first time this year. Since current investment strength is mainly government driven, the fall of fiscal revenue will constrain a possible investment rebound. Retail sales of consumer goods were up 10.2% y/y in nominal terms in November, the same rate as in Q3. The consumption indicator is always very stable. The ex-factory price index of industrial output was up 5.8% y/y in November, and PPI was up 7.1% y/y, down 1.1 and 1.3 pps respectively from October, indicating that price appreciation since August represents only a temporary rebound.
M1 was up 12.7% y/y by the end of November, down 0.3 pps from the end of October, showing a consecutive downward trend. Deposits from non-financial enterprises rose 11.9% y/y, down 0.5 pps from the end of October. M2 rose 9.1% y/y, slightly higher than the lowest level, up 0.3 pps from the end of October, mainly affected by large increases from fiscal deposits and non-bank financial institution deposits.
Exports were up 12.3% y/y in November in dollar terms, and up 5.4 pps from October, outstripping the fastest growth rate of Q2. But we believe the fast export growth rate is likely an outlier.
Imports maintained their strong growth, up 17.7% y/y, and up 3.1 pps from Q3. Even conservatively speaking, we expect China to surpass the United States as the world’s largest importer in 2022. Consumption demand as a rising share of import increase will be a key opportunity for investors. This is part of the effort made by current Chinese leaders to further integrate with the rest of the world, and to curb China’s external imbalance, with such initiatives as the Road and Belt, and AIIB. China will also hold its first annual national “import expo” in 2018. By contrast, U.S. President Donald Trump seems to be moving in the opposite direction, most recently seen as threatening to withdraw foreign aid, simply because countries do not support his decision to recognize Jerusalem as Israel’s capital. Any withdrawal by the United States will give China room to expand its role in world trade.
 Growth was relatively stable in October. Industrial output was up 6.2% y/y, almost the same as in previous months. Yet key growth drivers weakened. Fixed asset investment was up 5.8% y/y, slightly above the nadir, but lower than the investment price level. So real investment growth is still negative, a key challenge for the future.
Retail sales of consumer goods were up 10% y/y in nominal terms, and 8.6% y/y in real terms. Both were the weakest growth figures of the year. Exports were up 6.9% y/y, declining from Q1 and Q2. We expect exports to continue to slide. Furthermore, the growth rate of industrial export delivery value could dip below zero next year. Imports were up 17.2% y/y, maintaining their fast growth trend, up 2.6 pps from Q3.
Producer prices continue to appreciate. The ex-factory price index of industrial output was up 6.9% y/y, and PPI was up 8.4% y/y. They grew 0.7% and 0.9% m/m, respectively. Among the composition of industrial output prices, industrial processing prices were up 7.6% y/y, a new high.
CPI was up 1.9% y/y, a slight increase, though stable from previous months. By the end of October, M2 was up 8.8% y/y, a new low, reflecting a continuation of monetary tightening.
There have been three major changes to financial regulations. On November 10th, it was announced that the government would relax or eliminate ownership limits in commercial banking, securities, futures, asset management and insurance. The same day, a cabinet-level financial stability committee was established, putting financial stability in an unprecedentedly high position. On November 19th, the Central Bank, together with all other financial regulatory bodies, issued a new guideline to more strictly regulate the asset management businesses.
Financial openness can increase the efficiency of capital allocation domestically, and can further lift the real economy’s productivity, by at least increasing financial competition among financial institutions. The Chinese government has also learned from Western countries’ past financial crisis history, by making financial stability a higher priority, since openness and liberalization are usually accompanied by instability. We view this openness with a prudential regulatory approach as a very positive direction.
 Growth in Q3 was stable, though slightly lower. GDP was up 6.8% y/y, down 0.1 pps from Q2. Industrial output rose 6.3% y/y, down 0.5 pps from Q2, but still higher than in Q3 2016. However, industrial output in real terms might be worse than official statistics indicate.
Since the beginning of 2017, fixed asset investment has been weakening. It rose 9.2% y/y in Q1, then fell to 8.3% y/y in Q2, and fell further to 5.8% y/y in Q3. After taking out the price factor, fixed asset investment fell -0.6% y/y, down 5.1 pps from Q1. But the good news is that paid-in investment funds rose by a relatively large 6.7% y/y. In Q3, the real estate market quickly cooled. The sales area grew only 1.2% y/y, down 12.8 pps from Q2. Sales revenue rose 3.9% y/y, down 15.4 pps from Q2.
Retail sales of social consumption goods were up 10.3% y/y in Q3 in nominal terms, and up 9.2% y/y in real terms, both down 0.5 pps from Q2. Total imports rose 14.6% y/y, flat on Q2, still a fast-growing trend. We expect imports will continue to rise. Exports rose 6.9% y/y, down 2.3 pps from Q2.
Producer prices continue to appreciate. The ex-factory price index of industrial products rose 6.9% y/y, up 1.4 pps from June. PPI rose 8.5% y/y, up 1.2 pps from June. At the end of September, the M2 money supply rose 9.2% y/y, down 0.2 pps from June. M1 rose 14% y/y, down 1 pps from June.
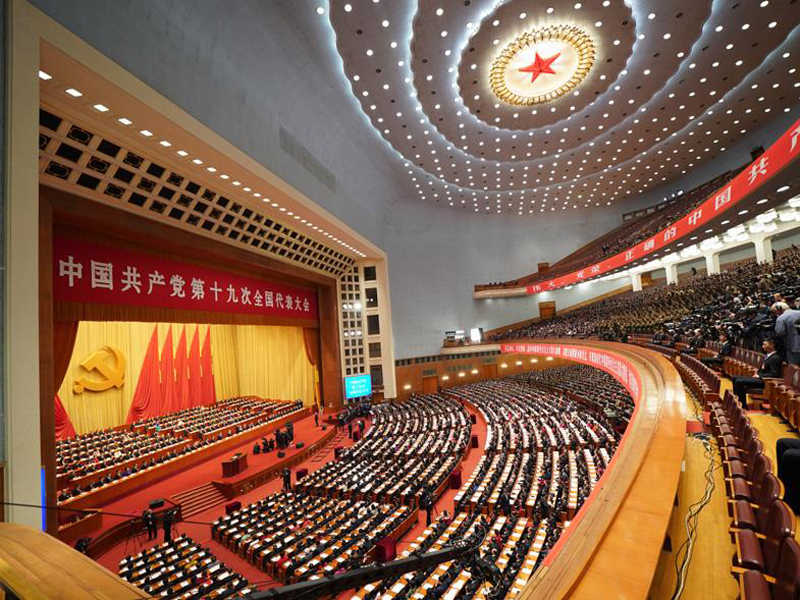
China’s Communist Party held its 19th National Congress this week, where it elected its new leadership and set its main policy themes for the next five years. President Xi Jinping will remain in his post, indicating a continuation of the current policy line. This announcement has significantly reduced policy uncertainty. In his report, Xi said the next five years’ main themes would be openness, entrepreneurship and resolving inequality.
Further openness is not only an extension of Belt and Road program, but also means further welcoming FDI and financial liberalization. These areas are viewed among economists as priorities for development. Entrepreneurship is for productivity growth, which is expected to be the key growth driver, rather than investment. Inequality is a primary issue for political stability in China. The government report specifically mentions IT. The extensive use of IT may have positive implications for the economy, as IT not only improves efficiency, but also may empower the central government. It can deliver sufficient information and monitoring ability for the conduct of government policy, and lead to better policy outcomes. We are positive on China’s future growth, given the government’s objectives -- but of course we need to watch closely, to see how these objectives will be implemented.
 Growth weakened in August. Industrial output was up 6% y/y, down 0.4 pps from July, and down 0.9 pps from Q2, which represented its lowest level of the year. Fixed asset investment, up 4.9%, was likewise at its lowest level of the year, down 3.4 pps from Q2.
But the ex-factory price index of industrial products rose 6.3% y/y, and was up 0.8 pps from July. PPI rose 7.7% y/y, up 0.7 pps from July. The producer price appreciation is hard to reconcile with weakening growth. We view economic fundamentals as sound, but macroeconomic uncertainty, especially driven by negative media reports, is slowing investment.
Retail sales of social consumption goods were up 8.9% y/y, down 0.7 pps from July, and down 0.8 pps from Q2. The weak retail sales can be partially explained by the crowding-out effect brought by booming housing prices. Exports were up 5.5% y/y, down 1.7 pps from July, and further down 3.7 pps from Q2. The RMB has appreciated against the dollar for four consecutive months since May, and was up more than 6%. Appreciation will negatively affect exports. Imports were up 13.2% y/y, down 0.7 pps from Q2, but will possibly increase further from RMB appreciation.
CPI was up 1.8% y/y, up 0.4 pps from July. Since we expect food price appreciation to increase further, CPI appreciation will continue as well. We expect CPI growth to exceed 2%, but be less than 2.5% y/y.
S&P Global Ratings on September 21st cut China’s sovereign credit rating for the first time since 1999, to A+ from AA-, citing the risks from soaring debt, and revised its outlook to stable from negative. We see this rating as overreaction, and misleading. Debt may not be a bad thing, especially when a country uses it to finance some long-term return projects, such as high-speed trains or urban subways, benefiting not only consumers but also firms, through market integration. We also agree with Chinese government officials’ response, that economic fundamentals are sound. Moreover, China’s external debt is small. All of these factors invalidate the claim of high risk.
More...
 Growth remained generally stable in July. Industrial output was up 6.4% y/y, similar to previous months. But fixed asset investment, the key growth driver, climbed only 6.8% y/y in real terms, its lowest rate this year, and was down 1.5 pps from Q2. Its adjusted growth rate is less than 5%, which will pressure future growth.
Real estate investment was hit by real estate market cooling, and was up just 4.7% y/y in July, down 3.4 pps from Q2. Imports were up 11% y/yy, down 3.2 pps. Import growth may even turn negative next year. Exports were up 7.2% y/y, down 2 pps from Q2. Retail sales of consumer goods have historically been less volatile, and were up 9.6% y/y in real terms in July, same rate as in June. CPI was slightly lower, up 1.4% y/y. But there are strong signs that vegetable, egg and pork prices will rebound, and CPI may rise to 2%. Producer price rises continued to slow. In July, ex-factory production prices rose 5.5% y/y, while PPI rose 7% y/y, down 0.3 pps from June.
Monetary policy in July continued falling back toward normal levels. M2 was up 9.2% y/y, down 2.1 pps from the end of 2016. M1 rose 15.3% y/y. Financial institutions’ estimated shadow banking investment increased 8.65 trillion yuan in 2016 alone, but decreased 845 billion yuan in Q2.
The National Financial Work Conference in July singled out prevention of financial risks as a top priority, including risks from outgoing investment. Chinese overseas M&A has often made major newspaper headlines in recent years, especially in 2016. After an August 18th session of the conference, the State Council gave detailed instructions about sectors where direct investment should be more restricted, and encouraged Chinese companies with M&A linked to real estate, hotels and entertainment, to be more cautious. This may reduce or even stop currently highly-leveraged corporations from investing. This initiative shows the government’s determination to rein in risk, and should prevent systemic financial risk.
 GDP rose 6.9% y/y in H1, up only 0.1 pps from Q4 2016. Industrial output rose 6.9% y/y, up 0.8 pps, and fixed asset investment rose 8.6%. But fixed asset investment’s real growth rate was just 3.8% y/y, down 5 pps from last year. Negatively affected by weak investment growth, we expect H2 growth to experience downward pressure. National household consumption spending rose 6.1% y/y, down 0.5 pps from H1 2016, reaching its lowest level since the creation of this measure in 2014. Retail sales of consumption goods rose 9.1% y/y in real terms, down 0.6 pps. Exports and imports are recovering, rising 8.5% and 18.9% y/y respectively, though both are still lower than in 2013 and 2014, and have much room for recovery.
The ex-factory price index of industrial goods peaked in February, with a growth rate of 7.8% y/y, and then declined, to 5.5% y/y in June. Similarly, PPI topped out in March, with growth of 10% y/y, falling to 7.3% y/y in June. We expect prices to be low in H2, based on the current non-loosening monetary policy.
In H1, negatively affected by financial deleveraging policies, the main financial indicators point mostly to persistent falling growth. At the end of June, M2 rose 9.4% y/y, down 1.9 pps from the end of 2016, reaching a historical low. M1 rose 15% y/y, down dramatically from recent high levels, and down 6.4 pps from the end of 2016.
National government revenue and expenditure rose 9.8% and 15.8% y/y respectively, generating a fiscal deficit of 918 billion CNY, 2.5 times that of H1 2016, constraining further fiscal expansion.
China’s top leaders have gathered every five years since 1997 for a National Financial Work Conference. On July 16th, during this meeting, financial risk was the main topic. The most concrete decision to emerge from the meeting so far has been President Xi Jinping’s announcement of the creation of a cabinet-level committee to coordinate financial oversight. We consider China’s financial or debt risk containable. Compared with the United States before the 2008 financial crisis, the Chinese government has at least recognized its debt risk. High debt, in contrast to other countries, mostly concentrates on the corporate sector – on state-owned enterprises in particular. The Chinese government has a large direct say in SOE debt restructuring. The centralization of financial oversight agencies can help avoid regulators’ coordination failure, and regulatory capture. China’s relative high economic growth also promises to contain its debt over the medium term.
Growth is relatively stable but still facing downward pressure. The value added for major industrial firms up 6.5% y/y in May – flat on April, and slightly below that of Q1, but still higher than all quarters of 2016. But as the key to growth, fixed asset investment was up 7.9% y/y, decreased 1.3 pps from Q1 after showing decreased trend for two consecutive months. Although current investment growth is not at its lowest rate, the adjusted rate below all quarters of last year after factoring in last year’s low base number. We therefore expect some pressure on future aggregate growth.
M2 reached a record low in May. It rose 9.6% y/y, down 0.9 pps from April, and down 2.2 pps from last May. This is partially due to the deleveraging efforts by monetary policy makers, but it certainly will put pressure on growth. Retail sales of consumption goods were up 10.7% y/y in nominal terms, flat on April. In May, exports grew 8.7% y/y, up 0.7 pps from Q1. Imports rose 14.8% y/y, down 9.8 pps from Q1. Over the medium term, as growth rates for producer prices turn downward, imports will continue to weaken, and might even consequently lead an export slowdown.
CPI was up 1.5% y/y in May, appreciating for three consecutive months, and up 0.3 pps from April. The ex-factory price index rose 5.5% y/y, down 0.9 pps from April. PPI rose 8% y/y, down 1 pps from April. The downward trends of producer prices confirm our previous forecast, and we expect this trend to continue.
The China Foreign Exchange Trade System trading platform, overseen by the Central Bank, announced the introduction of "counter-cyclical factor” into its calculation method of yuan's daily reference rate on May 26th. This will allow it to better reflect supply and demand over the long term, and to partially counter the short-term exchange rate fluctuations. We believe that this change will avoid currency herding, leading to a more fundamentals-based exchange rate. The change will increase the stability of yuan, reducing uncertainties for investors and trading partners. Meanwhile, the size of the FX reserve seems to be stabilizing in recent months, even under current environment while the new round of Fed interest rate hikes. It may be safe enough to expect much less volatility in the RMB exchange rate, at least for the rest of this year.

GDP was up 6.9% y/y in Q1, its fastest growth since last year, and up 0.1 pps from Q4 2016. However, given the end of producer price appreciation, and real estate market re-tightening, we expect this recovery to be temporary.
Industrial output rose 6.8% y/y, up 0.7 pps from Q4. March saw a particularly strong spike, up 7.6% y/y, its highest rate since 2015. Fixed asset investment rose 9.2% y/y, up 1.4 pps from Q4, when adjusted growth was only 4.5% y/y, after factoring in the Q1 investment price boom, down 1.9 pps.
Retail sales of consumption goods rose 10% y/y in Q1 in nominal terms, down 0.6 pps from Q4. The real term growth rate was 8.8% y/y in Q1, down 0.3 pps. Trade is balancing in Q1, with the trade surplus falling -47.8% y/y, while exports grew 8.2% y/y. Imports grew 24% y/y, up 21.3 pps, mainly driven by producer price appreciation, reflected in the commodity goods imports climb.
CPI was up 0.9% y/y in March, down 1.2 pps from December 2016. The large drop came mainly in the food category. Food prices fell -4.4% y/y, down 6.8 pps from December. In March, the ex-factory price index for industrial goods rose 7.6% y/y, down 0.2 pps from February. PPI rose 10% y/y, up only 0.1 pps from February. These two m/m growth rates also show obvious declines. We expect both growth rates to decline further.
M1 and M2 were up 18.8% y/y and 10.6% y/y at the end of March, down 2.6 and 0.7 pps from last December respectively. Other major financial indicators are also weakening.
The CCP central committee and state council announced in an April 4th joint statement that they plan to build a massive new city outside Beijing. Xiong’an is to be “three times the size of New York, and aims to achieve the same importance as Shenzhen and Shanghai Pudong, the announcement said. Simultaneously, residential land availability in Beijing is to expand significantly. These two policies indicate that China’s new approach to controlling housing bubbles as people rush to big cities will be increasing land supply in large urban centers, and building satellite cities nearby, instead of prioritizing small-city development. We view this as a positive measure to alleviate housing price appreciation pressure, while dealing with excessive housing supply in small cities, more and more people are leaving as they migrate to large urban centers.
")
")
")
")
")
")
")
")