
The Global Financial Centres Index

Click here to download the full report
The thirty-eighth edition of the Global Financial Centres Index (GFCI 38) was published on 25 September 2025. GFCI 38 provides evaluations of future competitiveness and rankings for 120 financial centres around the world. The GFCI serves as a valuable reference for policy and investment decision-makers.
China Development Institute and Z/Yen Partners in London collaborate in producing the GFCI. The GFCI is updated and published every March and September, and receives considerable attention from the global financial community.
135 financial centres were researched for GFCI 38 of which 120 are in the main index. The GFCI is compiled using 140 instrumental factors. These quantitative measures are provided by third parties including the World Bank, the OECD, and the United Nations.
The instrumental factors are combined with financial centre assessments provided by respondents to the GFCI online questionnaire. GFCI 38 uses 28,549 assessments from 4,877 respondents.
New York leads the index, with London second. Hong Kong retains third position ahead of Singapore. San Francisco, Chicago, Los Angeles, Shanghai, Shenzhen, and Seoul are unchanged in fifth to tenth positions.
We are able to assess 116 centres for their FinTech offering. Hong Kong takes top position followed by Shenzhen, with New York falling to third place. Singapore has overtaken London to take fourth position. Milan, Stockholm, Rome, Calgary, and Bahrain improved by over 20 places in the FinTech rankings. Five centres fell more than 15 places.
Editor’s note: We would be extremely grateful for your opinions on any financial centres in which you have done business. Your opinions will be used in the compilation of GFCI 39 due to be published in March 2026. Please take a few moments to help us. This questionnaire is unlikely to take more than five minutes to complete. In return for your help, we will send you a copy of our findings. Please be assured that answers will be kept confidential. Many thanks for your help.
Start the questionnaire: https://globalfinancialcentres.net/survey/
Click here to download the full report
The thirty-seventh edition of the Global Financial Centres Index (GFCI 37) was jointly published by Z/Yen and CDI on 20 March 2025. GFCI 37 provides evaluations of future competitiveness and rankings for 119 financial centres around the world. The GFCI serves as a valuable reference for policy and investment decision-makers.
The GFCI is compiled using 140 instrumental factors. These quantitative measures are provided by third parties including the World Bank, the Economist Intelligence Unit, the OECD and the United Nations.
The instrumental factors are combined with financial centre assessments provided by respondents to the GFCI online questionnaire. GFCI 37 uses 31,314 assessments from 4,946 respondents.
New York leads the index, with London second. Hong Kong retains third position ahead of Singapore. San Francisco, Chicago, Los Angeles, Shanghai, and Shenzhen are unchanged in fifth to ninth positions. Seoul re-entered the top 10 centres in this edition of the index.
We are able to assess 115 centres for their Fintech offering. New York retains its leading position in the Fintech ranking, followed by London and Shenzhen. Hong Kong rose five rank places, overtaking US centres and Singapore to take fourth position. Oslo, Mauritius, and Riyadh improved by over 20 places in the Fintech rankings. Six centres fell more than 15 places.
Click here to download the full report as PDF.
The thirty-sixth edition of the Global Financial Centres Index (GFCI 36) was jointly published by Z/Yen and CDI on 24 September 2024. GFCI 36 provides evaluations of future competitiveness and rankings for 121 financial centres around the world. The GFCI serves as a valuable reference for policy and investment decision-makers.
The GFCI is compiled using 143 instrumental factors. These quantitative measures are provided by third parties including the World Bank, the Economist Intelligence Unit, the OECD and the United Nations.
The instrumental factors are combined with financial centre assessments provided by respondents to the GFCI online questionnaire. GFCI 36 uses 37,830 assessments from 6,188 respondents.
New York leads the index, with London second. Hong Kong has overtaken Singapore to regain third position. San Francisco remains at number five, with Chicago and Los Angeles overtaking Shanghai to place sixth and seventh, with Shanghai now in eighth position. Shenzhen and Frankfurt complete the top 10.
We are able to assess 116 centres for their Fintech offering. New York retains its leading position in the Fintech ranking, followed by London. Shenzhen overtook San Francisco to take third position by just one rating point. Hong Kong has joined Washington DC, Los Angeles, Chicago, Singapore, and Seoul in the top 10, replacing Shanghai, which has dropped to 15th position.
Click here to download the full report as PDF.
The thirty-fifth edition of the Global Financial Centres Index (GFCI 35) was jointly published by Z/Yen and CDI on 21 March 2024. GFCI 35 provides evaluations of future competitiveness and rankings for 121 financial centres around the world. The GFCI serves as a valuable reference for policy and investment decision-makers.
The GFCI is compiled using 145 instrumental factors. These quantitative measures are provided by third parties including the World Bank, the Economist Intelligence Unit, the OECD and the United Nations.
The instrumental factors are combined with financial centre assessments provided by respondents to the GFCI online questionnaire. GFCI 35 uses 48,365 assessments from 8,494 respondents.
New York leads the index, with London second, ahead of Singapore in third place, which has maintained its slight lead over Hong Kong in fourth position. San Francisco remains at number five, with Shanghai overtaking Los Angeles in sixth place, with the latter dropping to eighth. Geneva climbed to seventh, with Chicago stable in ninth, and Seoul entering at number 10.
We are able to assess 116 centres for their Fintech offering, with Wellington entering the Fintech rankings for the first time in 23rd place. New York retains its leading position in the Fintech ranking, followed by London, then San Francisco. Shenzhen maintains its fourth place in the table and Washington DC moved ahead to fifth place overtaking Singapore.
Click here to download the full report as PDF.
The thirty-fouth edition of the Global Financial Centres Index (GFCI 34) was jointly published by Z/Yen and CDI on 28 September 2023. GFCI 34 provides evaluations of future competitiveness and rankings for 121 financial centres around the world. The GFCI serves as a valuable reference for policy and investment decision-makers.
The GFCI is compiled using 147 instrumental factors. These quantitative measures are provided by third parties including the World Bank, the Economist Intelligence Unit, the OECD and the United Nations.
The instrumental factors are combined with financial centre assessments provided by respondents to the GFCI online questionnaire. GFCI 34 uses 53,789 assessments from 9,097 respondents.
New York leads the index, with London second, ahead of Singapore in third place, which has maintained its slight lead over Hong Kong in fourth position. Washington DC and Geneva entered the top 10 in this edition, replacing Seoul and Boston.
We are able to assess 115 centres for their Fintech offering. New York retains its leading position in the Fintech ranking, followed by London, which overtook San Francisco to take second position. Shenzhen maintained its fourth place in the table. Beijing has joined Singapore, Los Angeles, Washington DC, Shanghai, and Chicago in the top 10, replacing Boston.
Click here to download the full report as PDF.
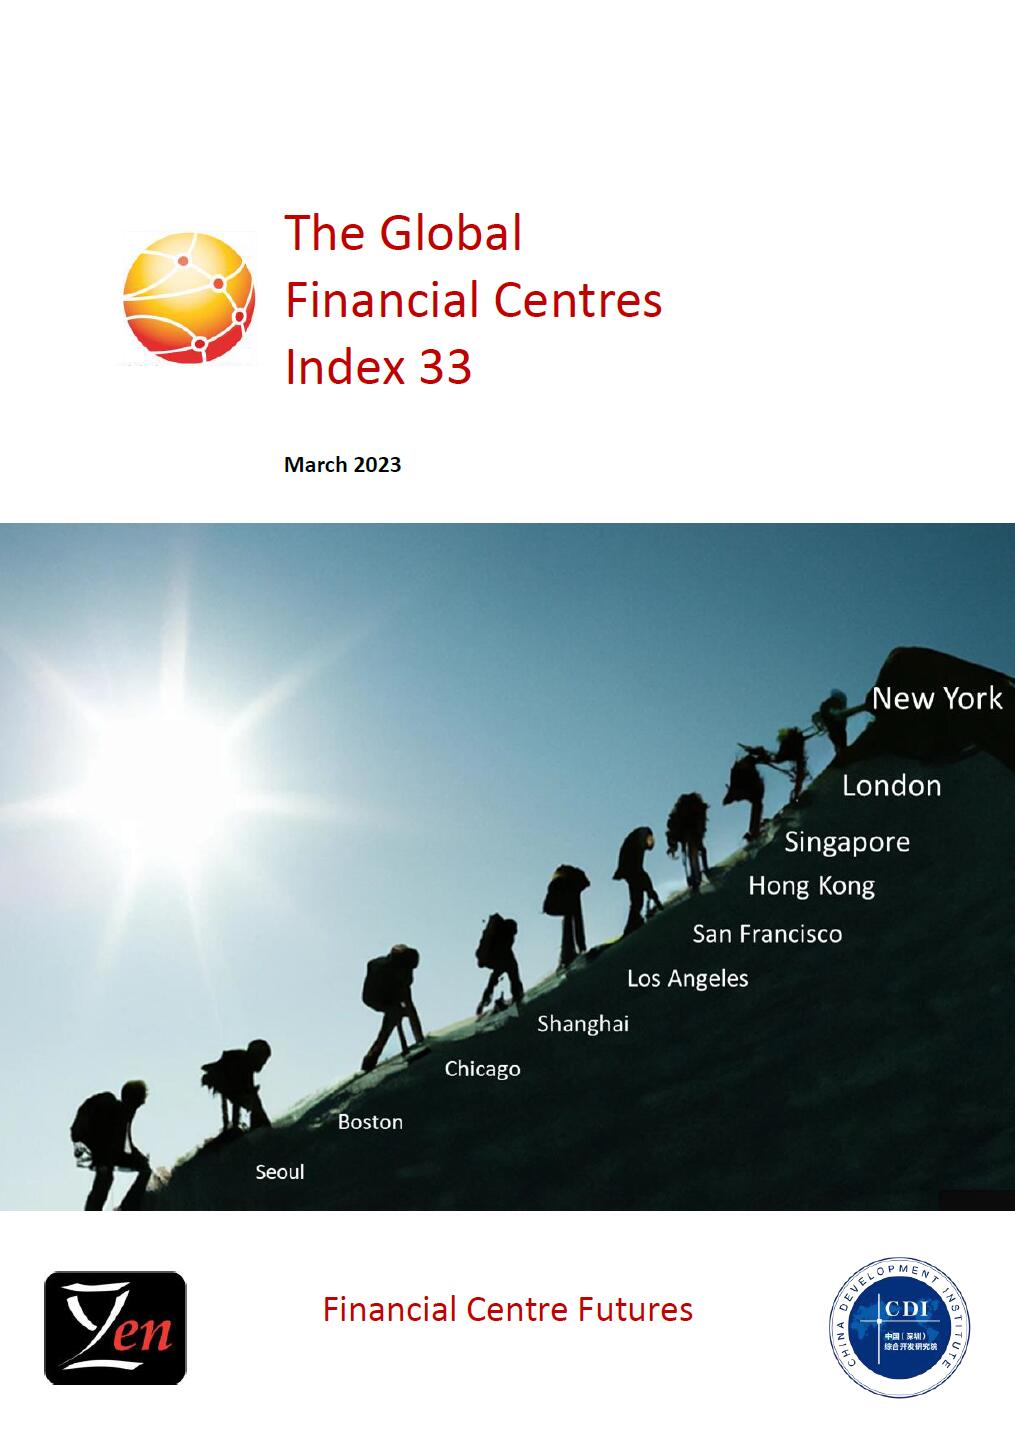
The thirty-third edition of the Global Financial Centres Index (GFCI 33) was jointly published by Z/Yen and CDI on 23 Mar 2023. GFCI 33 provides evaluations of competitiveness and rankings for 120 financial centres around the world. The GFCI serves as a valuable reference for policy and investment decision-makers.
The GFCI 33 was compiled using 153 instrumental factors. These quantitative measures are provided by third parties including the World Bank, the Economist Intelligence Unit, the OECD and the United Nations. The instrumental factors were combined with 61,449 assessments of financial centres provided by 10,252 respondents to the GFCI online questionnaire.
The average rating of centres in the index was close to the average in GFCI 32, just 0.06% lower. However, within this average, 31 out of the top 40 centres in the index fell in the ratings, while half of the centres in the bottom half of the index improved their rating. While there is considerable variation across centres, this outcome suggests that confidence in financial centres and the world economy remains high, with a recognition that inflation levels are falling and economic growth generally secure, even with the instability caused by the continuing war in Ukraine.
US centres performed well, with five US centres now in the top 10, reflecting the strength of the US economy. Leading Chinese centres fell back a little. London retains its position in second place in the index, despite some predictions of a downturn in London’s fortunes. This suggests that London retains its reputation in financial services and that the UK’s financial services sector remains competitive.
We are able to assess 114 centres for their FinTech offering. New York retains its leading position in the FinTech ranking, followed by San Francisco. London moved up one place to third, and Shenzhen rose three places to take fourth position. Los Angeles, Boston, Chicago, and Shanghai continue to feature in the top 10, while Singapore and Washington enter the top 10 for FinTech, displacing Beijing and Hong Kong.
Click here to download the full report as PDF.
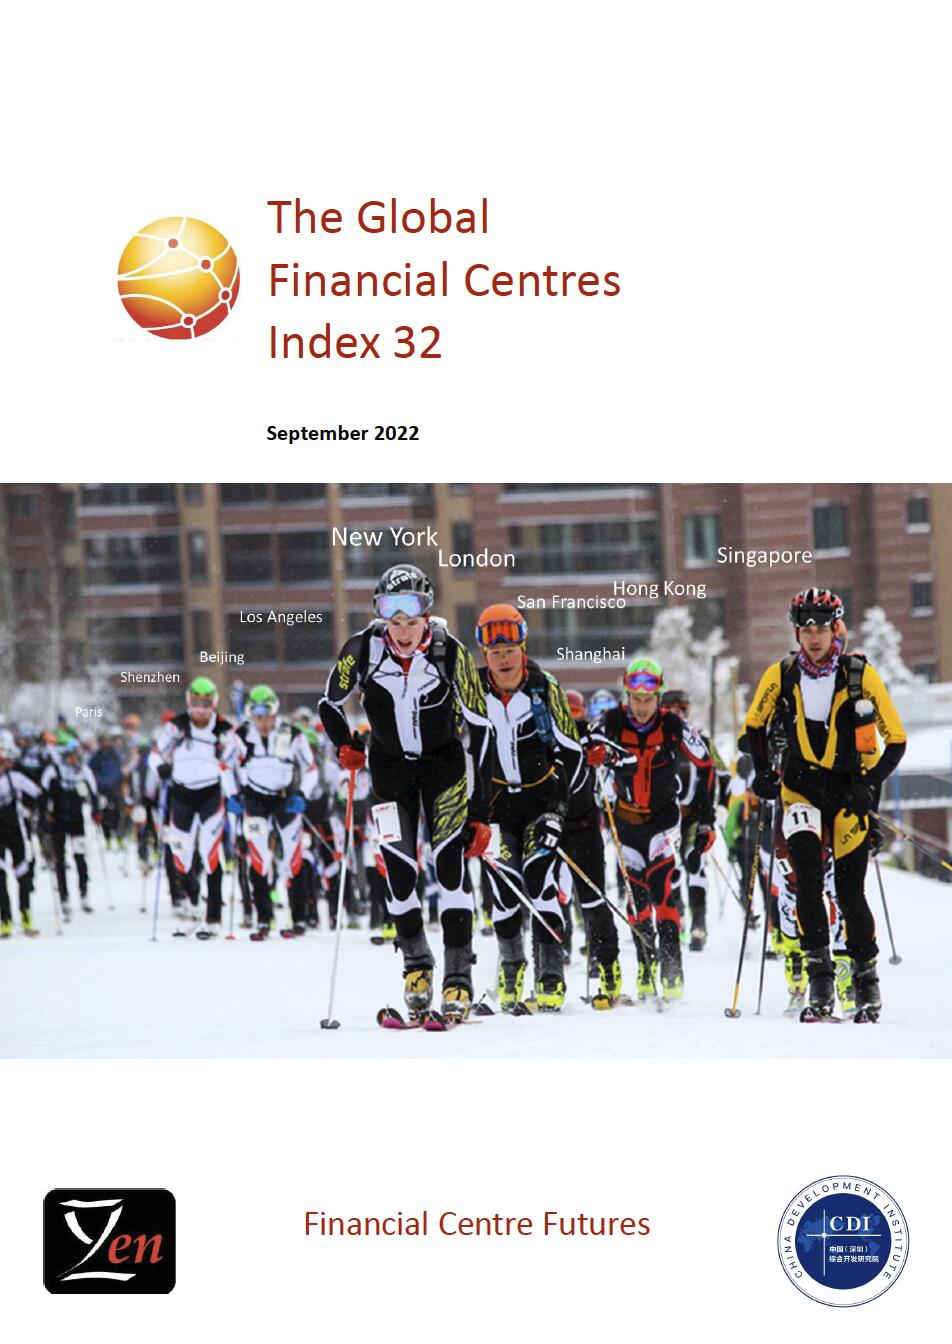
The thirty-second edition of the Global Financial Centres Index (GFCI 32) was jointly published by Z/Yen and CDI on 22 Sept 2022. GFCI 32 provides evaluations of competitiveness and rankings for 119 financial centres around the world. The GFCI serves as a valuable reference for policy and investment decision-makers.
The GFCI 32 was compiled using 151 instrumental factors. These quantitative measures are provided by third parties including the World Bank, the Economist Intelligence Unit, the OECD and the United Nations. The instrumental factors were combined with 66,121 assessments of financial centres provided by 11,038 respondents to the GFCI online questionnaire.
Overall the average rating of centres in the index improved 4.83% from GFCI 31, regaining the average ratings last recorded in GFCI 27 in March 2020. This suggests that there is confidence in financial centres themselves, even against a background of the Russian-Ukraine conflict, economic and energy instability, and inflationary pressures.
New York leads the index, with London second, ahead of Singapore in third place, which has overtaken Hong Kong in fourth position. Paris returned to the top ten in the index, replacing Tokyo which fell to 16th place, perhaps reflecting a comparatively slow consumer recovery following the Covid-19 pandemic. London continues to lead in the Western European region, and rose 5 points in the ratings. Other leading Western European centres also gained in the ratings. Performance in Asia/Pacific centres was balanced, with half of these centres maintaining or improving their rank, and half falling in the rankings.
We are able to assess 113 centres for their FinTech offering. New York retains its leading position in the FinTech ranking, followed by San Francisco, Los Angeles, and London, with Shanghai and Beijing in fifth and sixth place. Chinese, US, and German centres performed well in the Fintech ratings.
Click here to download the full report as PDF.
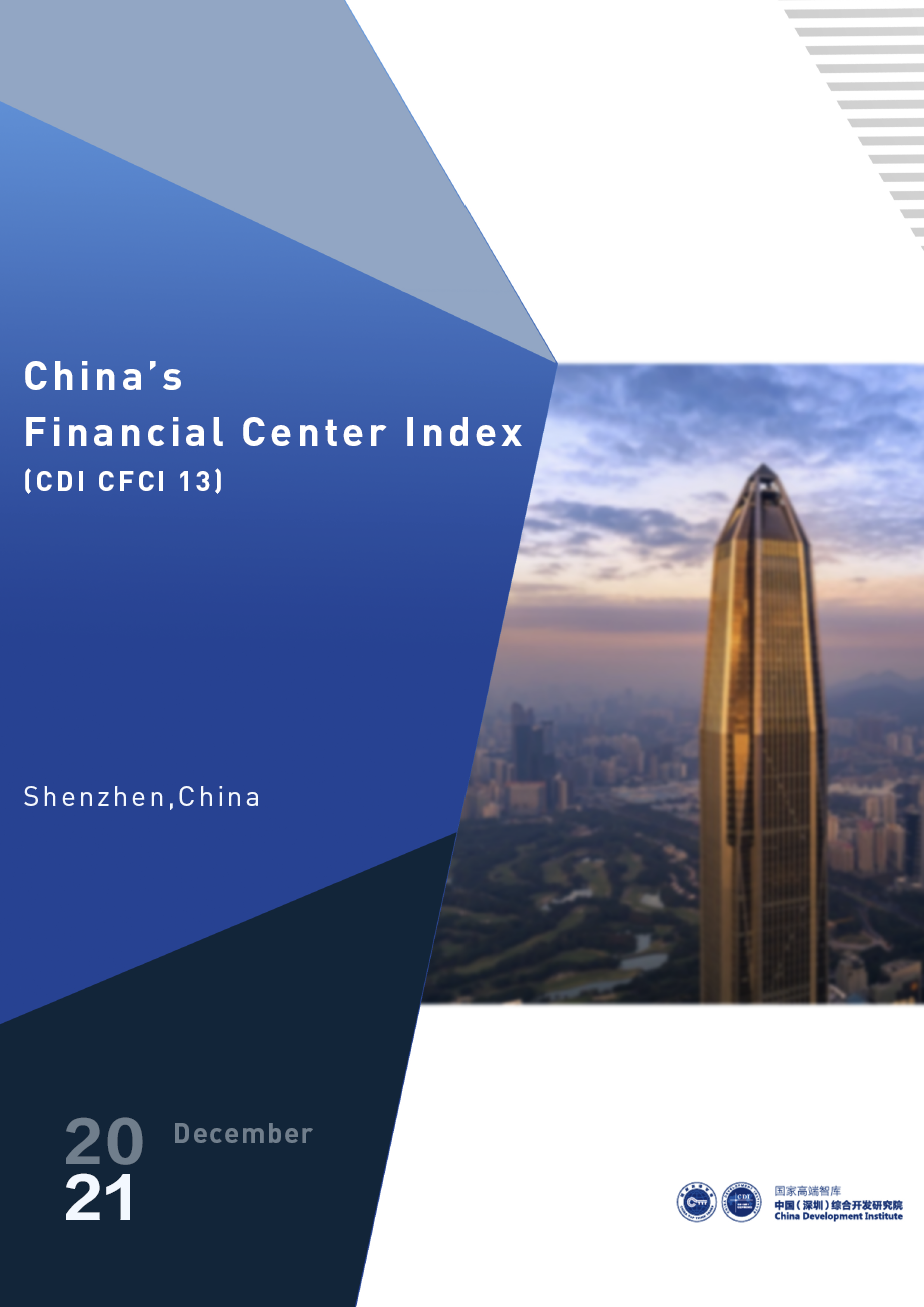
China’s Financial Center Index (CFCI) has established a system for competitiveness evaluation adapted to the development characteristics of Chinese financial centers. The system aims to track and study the development status of Chinese financial centers, in a bid to inform policy optimization by relevant decisionmakers, and provide a watchtower for the society to observe the development of Chinese financial centers. The first CFCI was released in 2009 and has been updated annually since then.
Click here to download the full report as PDF.
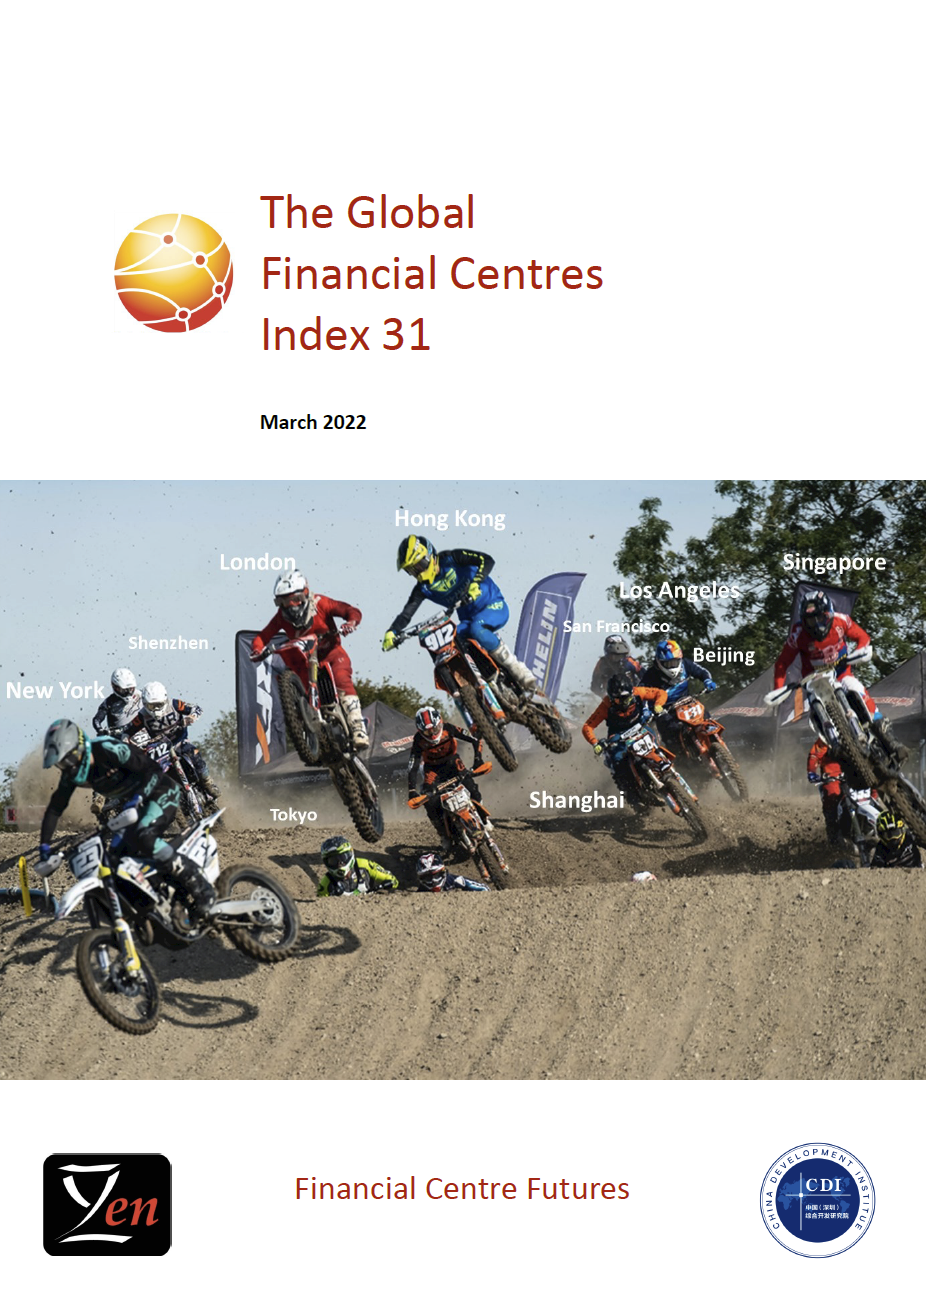
The thirty-first edition of the Global Financial Centres Index (GFCI 31) was jointly published by Z/Yen and CDI on 24 March 2022. GFCI 31 provides evaluations of future competitiveness and rankings for 119 financial centres around the world. The GFCI serves as a valuable reference for policy and investment decision-makers.
The GFCI is compiled using 150 instrumental factors. These quantitative measures are provided by third parties including the World Bank, the Economist Intelligence Unit, the OECD and the United Nations. The instrumental factors are combined with financial centres assessments provided by respondents to the GFCI online questionnaire.
The data on which GFCI 31 is based relate to the period up to the end of 2021. Overall the average rating was stable, less than one point lower than GFCI 30, following three consecutive drops in the average rating.
Asia/Pacific centres generally recovered losses that they experienced in GFCI 30. This suggests that there is restored confidence in the economic strength of the region, and in trade performance. North American and Western European centres had generally stable performance.
New York leads the index, with London second, ahead of Hong Kong and Shanghai. Shenzhen returned to the top ten in the index, replacing Paris, which fell to 11th place. The ratings of most of the leading centres were relatively stable, only changing by a few points.
We are able to assess 113 centres for their Fintech offering. New York and Shanghai retain their leading positions at first and second place. Beijing and San Francisco overtook London to take third and fourth place.
Click here to download the full report as PDF.
On September 24, Z/Yen and CDI jointly released the thirtieth edition of the Global Financial Centres Index (GFCI 30) in Busan.
We researched 126 centres for this edition of the Global Financial Centres Index (GFCI 30). The number of financial centres in the main index has increased from 114 to 116 with the addition of Kigali and Lagos. There are 10 associate centres awaiting potential inclusion in the main index.
GFCI 30 was compiled using 146 instrumental factors. These quantitative measures are provided by third parties including the World Bank, The Economist Intelligence Unit, the OECD, and the UN.
New York leads the ranking, with London second. Both centres fell only slightly in the ratings. Hong Kong and Singapore in third and fourth positions fell 25 points in the ratings. San Francisco, Los Angeles, and Paris entered the top 10 in GFCI 30, with falls in the ratings and
rankings for other leading Asian centres. Nine of the top 10 centres in the index fell in the ratings.
Overall the average rating fell 12.9 points (2.05%). While a small change, this is the third
consecutive fall in the average rating.
More...
Click here to download the full report as PDF.
On March 17, Z/Yen and CDI jointly released the twenty-nineth edition of the Global Financial Centres Index (GFCI 29) in Shenzhen, London and Hongkong.
We researched 126 centres for this edition of the Global Financial Centres Index (GFCI 29). The number of financial centres in the main index has increased from 111 to 114 with the addition of Berlin, Trinidad & Tobago, and Bogota. There are 12 associate centres awaiting potential inclusion in the main index.
GFCI 29 was compiled using 143 instrumental factors. These quantitative measures are provided by third parties including the World Bank, The Economist Intelligence Unit, the OECD, and the UN.
New York retains first place in the index. London fell to only one point ahead of third place Shanghai. Hong Kong moved up a place to fourth, one point behind Shanghai, with Singapore in fifth position. Tokyo dropped three places from fourth to seventh. Frankfurt replaced San Francisco in the top 10 in this edition, gaining seven rank places, perhaps benefiting from the exit of the UK from the European Union.
The average rating of centres in the index dropped only 3.5 points (-0.55%) from GFCI 28 (41 points from GFCI 27 to GFCI 28), which may indicate more confidence in the financial system than in the first stages of the covid-19 pandemic.
Click here to download the full report as PDF.
On September 28, Z/Yen and CDI jointly released the twenty-eighth edition of the Global Financial Centres Index (GFCI 28) in Shenzhen and Seoul.
In GFCI 28, we researched 121 centres for this edition of the Global Financial Centres Index (GFCI 28). The number of financial centres in the main index has increased from 108 to 111 with the addition of Bratislava, Xi’an, and Wuhan, though new entrants to the index take some time for their position in the index to settle. There are 10 associate centres awaiting potential inclusion in the main index.
GFCI 28 was compiled using 138 instrumental factors. These quantitative measures are provided by third parties including the World Bank, The Economist Intelligence Unit, the OECD, and the UN.
New York retains its first place in the index, although London in second place has made up ground in the ratings, now only four points behind the leader. Shanghai moved up one place to third and Tokyo dropped one place to fourth, although only one point separates them in the ratings. Similarly, Hong Kong moved up a place to rank fifth and Singapore fell one place to sixth, again with only one point separating Hong Kong and Singapore in the ratings.Shenzhen and Zurich entered the top ten in this edition, replacing Los Angeles and Geneva.
12 financial centres across the Chinese mainland were included in the main index, among them Beijing, Shanghai, Shenzhen ranked in the top 10 and followed by Guangzhou (21),Chengdu (43), Qingdao(47) and Nanjing(89).
The average rating of centres in the index has dropped 41 points (6.25%) in just one edition. The enormous economic impact of the covid-19 pandemic is not the only reason. Before covid-19 uncertainty was already rising sharply about the future of international trade, technology, the future of workplaces, climate change, and geopolitical stability. These factors have led to significantly increased volatility in our last two editions of the index.
Whileaverage ratings fell, all of the top ten centres in the index increased their ratings in GFCI 28, reversing recent trends. During the pandemic, financial services returned to big, safe, financial centreharbours. Yet the economic performance of cities with high commuter intensity, such as New York or London, has been extremely poor.
Click here to download the full report as PDF.
On March 26, Z/Yen and CDI jointly released the twenty-seventh edition of the Global Financial Centres Index (GFCI 27) in Shenzhen and Seoul.
In GFCI 27, we researched 120 centres for this edition, with 104 centres in the main index and 12 in the associate list.
GFCI 27 was compiled using 138 instrumental factors drawn from the United Nations, World Bank, etc., with the combination of 37,695 financial centre assessments provided by respondents to the GFCI online questionnaire.
GFCI 27 showed a high level of volatility, with 26 centres rising ten or more places in the rankings and 23 falling ten or more places. This may reflect the uncertainty around the international trade and the impact of geopolitical unrest.
New York remains in the first place in the index, further extending its lead over London to 27 points. Both Tokyo and Shanghai improved their ranking in the top 10, with Tokyo in third and Shanghai in fourth. Their ratings are only one point and two points behind London respectively. Hong Kong fell from third place to sixth. Singapore fell from fourth to fifth place.
10 financial centres across the Chinese mainland were included in the main index, namely Shanghai, Beijing, Shenzhen, Guangzhou, Chengdu, Hangzhou, Qingdao, Tianjin, Nanjing, and Dalian. Shanghai, Beijing, Shenzhen, Guangzhou ranked in the top 20, while others had somewhat downbeat performance probably because the financial professionals around the globe are not familiar with them.
Click here to download the full report as PDF.
Financial centres are key to sustain economic growth, as they provide the infrastructure for investment and savings that drives entrepreneurial endeavours. Their prime purpose is to meet growing global funding needs, and these are expected to be particularly high for the next ten to twenty years. In a world confronted with complex issues - including technological disruption, climate change, ageing populations and social issues - access to market financing, accelerated market opening and the competitiveness of the financial centres have become major new challenges, for the satisfaction of economic and social needs. The collection of data on the different financial centres is therefore of utmost importance and should provide as objective an analysis as possible.
In this context, the Paris Financial Centre strives to develop a financial industry that serves society and contributes to a real and sustainable economy. To this aim, it intends to capitalise on its strong assets, which allowed its moving up ten places in the GFCI September edition.
Indeed, Paris is the only ‘global city’ in the EU, on a par with London, and the leading financial centre in the EU27. It also benefits from a complete ecosystem, including clients, talents and quality infrastructures, as well as from a regulation recognised at
international level and a quality dialogue between regulators and market participants. In addition, the Paris Financial Centre has benefitted, since the election of President Macron, from a strong involvement of the French public authorities to consolidate its position as a leading financial centre. And what has been announced has been implemented. The flexibility of labour law, taxation - in particular in relation to impatriates - the cost of labour and infrastructures - e.g. the international schooling offer - have all been significantly improved.
Today, the Paris Financial Centre is unfolding a new strategy to consolidate its position as financial centre of the future in Europe, based on three main priorities:
• a fully-fledged fintech ecosystem - with striving companies, a large talent pool, a significant number of incubators, and the support of French authorities and regulators;
• sustainable and environmental finance - Paris is the world leader in green bond issues and a driving force in the transformation towards a low-carbon economy;
• infrastructure financing.
It also intends to increase its contribution at European and international level.
")
")
")
")
")
")
")
")